|
|
|
|
|
|
|
|
|
|
|
|
|
|
|
After pharmacologic agents have stimulated excitable cell-membrane proteins and have produced a physiologic effect, it is important to evaluate the effect clinically. This section focuses on methods of evaluating drug effects such as dose-response curves, efficacy, potency, the median effective dose (ED50 ), the median lethal dose (LD50 ), and the therapeutic index.
The standard comparison of a drug with its clinical effect is
the concentration versus response curve ( Fig.
3-35
). The relationship shown is the time-independent relationship between
dose, concentration, or some other measure of exposure to the drug (x
axis) and the measured effect (y axis). The measured
effect can be an absolute response (e.g., twitch height), a normalized response (e.g.,
percentage of twitch height depression), or a population response (e.g., fraction
of subjects moving at incision). The standard equation for this relationship is
the Hill equation, sometimes called the sigmoid-Emax
relationship:
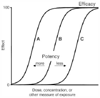 Figure 3-35
Dose or concentration versus response. A sigmoidal concentration-response
curve is generated when the log drug concentration is plotted against the clinical
response or effect. The concentration-response curve is shifted to the right (B
to C) in the presence of a competitive antagonist or desensitization. Curve C may
also represent an agonist with a lower receptor affinity (Ka
) or potency
than curve B. Curve A represents an agonist with higher receptor affinity or potency
than curve B.
Figure 3-35
Dose or concentration versus response. A sigmoidal concentration-response
curve is generated when the log drug concentration is plotted against the clinical
response or effect. The concentration-response curve is shifted to the right (B
to C) in the presence of a competitive antagonist or desensitization. Curve C may
also represent an agonist with a lower receptor affinity (Ka
) or potency
than curve B. Curve A represents an agonist with higher receptor affinity or potency
than curve B.
Considerable confusion exists about the definition of potency because of competing definitions of the term. One use of potency is to describe the effect of a given dose of the drug. Consider two different oral preparations of an identical drug: one that dissolves quickly in the stomach and is rapidly absorbed, and one that never completely dissolves and is poorly absorbed. A given dose of the rapidly absorbed formulation can produce a more profound drug effect and therefore be considered more potent than an identical dose of the slowly absorbed formulation. From a therapeutic perspective, potency is often defined in terms of the dose versus response relationship.
From a pharmacologic perspective, potency is best described in terms of the concentration versus response relationship. As shown in Figure 3-35 , a drug with a left-shifted concentration versus response curve (i.e., lower C50 ) is considered more potent, and a right-shifted dose versus response curve renders it less potent. To be precise, potency should be defined in terms of a specific drug effect (e.g., 50% of maximal effect). This is particularly important if the two drugs have different Hill coefficients or efficacies.
Efficacy is a measure of the intrinsic ability of a drug to produce a given physiologic or clinical effect ( Fig. 3-36 ). For example, in G protein-coupled receptors efficacy is influenced by receptor coupling to G proteins, activation of second messengers, and the ability to generate ultimate physiologic responses. The scale used to describe intrinsic efficacy at a given receptor ranges from 0 to 1. Efficacy for full agonists is 1.0, for neutral antagonists is 0, and for partial agonists ranges between 0 and 1.0. In contrast, the term potency refers to the quantity of drug that must be administered to produce a specific effect. Two drugs may have the same efficacy, but if one drug produces the maximum effect at 1 mg and the second drug produces the maximum effect only at 100 mg, the second drug is less potent. The differences between a full agonist and a partial agonist (see Fig. 3-23 and Fig. 3-24 ) represent differences in efficacy.
The ED50 is the dose of a drug required to produce a specific effect in 50% of individuals to whom it is administered. The LD50 is the dose of a drug required to produce death in 50% of patients (or animals) to whom it is administered. The therapeutic index of a drug is the ratio
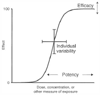 Figure 3-36
Relationships among efficacy, potency, and individual
variability as they related to a typical sigmoidal dose or concentration versus response
curve.
Figure 3-36
Relationships among efficacy, potency, and individual
variability as they related to a typical sigmoidal dose or concentration versus response
curve.
Agonists and antagonists modify dose-response relationships. If two agonists have an identical affinity (Ka ) for a given receptor and identical effectiveness in coupling to second messengers, their resultant dose-response curves should be superimposable. However, if two agonists have different receptor affinities, despite identical effectiveness in coupling to second messengers, their dose-response curves are parallel (with the rightward shifted curve corresponding to the drug with lower receptor affinity) (see Fig. 3-35, curves B and C ). When two agonists are administered simultaneously, the clinical effect depends on the total amount of drug-receptor complexes generated.
Full agonists produce maximal responses, whereas partial agonists produce less than maximal response at the same receptor occupancy. The precise molecular mechanism that explains this blunting of the maximal response by partial agonists is unknown, but it may reflect the ability of full agonists to stabilize R* most effectively. Partial agonists shift the dose-response curve of the agonist to the right (see Fig. 3-35, curves B to C ).
The addition of a competitive antagonist also shifts the dose-response curve to the right (see Fig. 3-35, B to C ). In contrast, the addition of a noncompetitive agonist shifts the dose-response curve to the right and reduces the efficacy of the agonist. This occurs because maximal response cannot be obtained at any agonist dose because blockade of effect (i.e., antagonism) cannot be reversed.
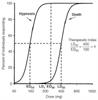 Figure 3-37
Relationships among the median effective dose (ED50
),
median lethal dose (LD50
), and therapeutic index. These curves were generated
from data on animals that were injected with various doses of a sedative-hypnotic
and the clinical responses determined. ED50
is the dose of drug required
to produce a specific effect (i.e., hypnosis) in 50% of animals to which it is administered
(left curve). LD50
is the dose of drug
required to produce death in 50% of animals to which drug is administered (right
curve). The therapeutic index of the drug is the ratio between LD50
and ED50
(LD50
/ED50
). LD1
is the lethal
dose in 1% of the population, and ED99
is the effective dose in 99% of
the population. As drawn, LD1
< ED99
, which would not be
clinically acceptable.
Figure 3-37
Relationships among the median effective dose (ED50
),
median lethal dose (LD50
), and therapeutic index. These curves were generated
from data on animals that were injected with various doses of a sedative-hypnotic
and the clinical responses determined. ED50
is the dose of drug required
to produce a specific effect (i.e., hypnosis) in 50% of animals to which it is administered
(left curve). LD50
is the dose of drug
required to produce death in 50% of animals to which drug is administered (right
curve). The therapeutic index of the drug is the ratio between LD50
and ED50
(LD50
/ED50
). LD1
is the lethal
dose in 1% of the population, and ED99
is the effective dose in 99% of
the population. As drawn, LD1
< ED99
, which would not be
clinically acceptable.
Anesthesia is the practice of applied drug interactions. As discussed in Chapter 31 , general anesthesia is, at a minimum, a combination of hypnosis and analgesia. There has been extensive work looking at the interaction of hypnotic drugs, which include inhaled anesthetics and GABA agonists (i.e., propofol, barbiturates, etomidate, and benzodiazepines), and analgesic drugs, specifically opioids.
A prototypical study of the relationship between inhaled anesthetics and opioids is the investigation by McEwan and colleagues,[16] who characterized the interaction between isoflurane and fentanyl. The minimum alveolar concentration (MAC) of isoflurane associated with a 50% chance of moving on incision is compared with the plasma fentanyl concentration in Figure 3-38 . Initially, the interaction is profound, with a 50% reduction in isoflurane MAC at a plasma fentanyl concentration of 1.7 ng/mL and a 63% reduction in isoflurane MAC associated with a plasma fentanyl concentration of 3 ng/mL. Beyond 3 ng/mL, there is very little benefit from additional fentanyl. The first clinical implication of this interaction is that a modest amount of opioid dramatically reduces the concentrations of inhaled anesthetic required to prevent movement. The second clinical implication is that some hypnotic component must be added to the anesthetic to prevent movement, even with huge doses of opioids.
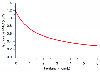 Figure 3-38
Influence of fentanyl on the minimum alveolar concentration
(MAC) of isoflurane associated with a 50% probability of movement on incision. Modest
amounts of fentanyl greatly reduce the MAC of isoflurane, but a ceiling in MAC reduction
is quickly reached. Even with large opioid doses, some isoflurane is required to
ablate the movement response. (Adapted from McEwan AI, Smith C, Dyar O,
et al: Isoflurane minimum alveolar concentration reduction by fentanyl. Anesthesiology
78:864–869, 1993.)
Figure 3-38
Influence of fentanyl on the minimum alveolar concentration
(MAC) of isoflurane associated with a 50% probability of movement on incision. Modest
amounts of fentanyl greatly reduce the MAC of isoflurane, but a ceiling in MAC reduction
is quickly reached. Even with large opioid doses, some isoflurane is required to
ablate the movement response. (Adapted from McEwan AI, Smith C, Dyar O,
et al: Isoflurane minimum alveolar concentration reduction by fentanyl. Anesthesiology
78:864–869, 1993.)
Similar work has been done for propofol. In a series of elegant studies, Vuyk and colleagues[17] characterized the interaction of propofol with alfentanil. The interaction is markedly synergistic, with modest amounts of alfentanil greatly decreasing the amount of propofol associated with a 50% chance of response to endotracheal intubation or surgical incision ( Fig. 3-39 ). Vuyk and colleagues[17] also documented the interaction of propofol and alfentanil
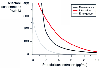 Figure 3-39
Influence of alfentanil on the concentration of propofol
associated with a 50% probability of response to intubation and incision, as well
as a 50% probability of awakening at the end of surgery. Moderate doses of alfentanil
greatly reduce the dose of propofol required to ablate the response to noxious stimulation.
However, below propofol concentrations of approximately 2 µg/mL, even large
doses of alfentanil cannot reliably ablate the response to noxious stimulation.
(Adapted from Vuyk J, Lim T, Engbers FH, et al: The pharmacodynamic interaction
of propofol and alfentanil during lower abdominal surgery in women. Anesthesiology
83:8–22, 1995.)
Figure 3-39
Influence of alfentanil on the concentration of propofol
associated with a 50% probability of response to intubation and incision, as well
as a 50% probability of awakening at the end of surgery. Moderate doses of alfentanil
greatly reduce the dose of propofol required to ablate the response to noxious stimulation.
However, below propofol concentrations of approximately 2 µg/mL, even large
doses of alfentanil cannot reliably ablate the response to noxious stimulation.
(Adapted from Vuyk J, Lim T, Engbers FH, et al: The pharmacodynamic interaction
of propofol and alfentanil during lower abdominal surgery in women. Anesthesiology
83:8–22, 1995.)
Classic interaction studies, such as those previously described, examine the concentrations associated with a particular response (e.g., a 50% chance of moving) for two drugs, evaluated separately and in combination. However, a more general view is that any combination of two drugs is associated with a response. This is best viewed as a response surface in which the x and y axes of the surface are concentrations (or doses) of drugs A and B, and the z axis is the response to the particular combination. Minto and colleagues[18] proposed a mathematical framework for response surfaces for a variety of interaction surfaces of interest to anesthesiologists. Figure 3-40 shows six examples of response surfaces that apply to a variety of anesthetic drugs.
|
|
|
|
|
|
|
|
|
|
|
|
|