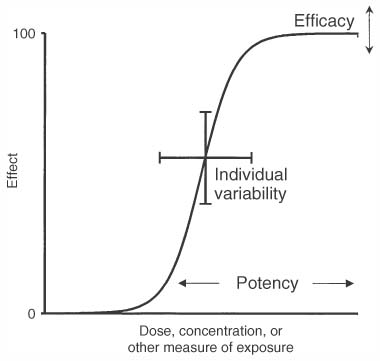
Figure 3-36 Relationships among efficacy, potency, and individual variability as they related to a typical sigmoidal dose or concentration versus response curve.