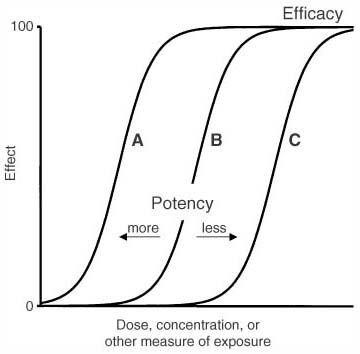
Figure 3-35
Dose or concentration versus response. A sigmoidal concentration-response
curve is generated when the log drug concentration is plotted against the clinical
response or effect. The concentration-response curve is shifted to the right (B
to C) in the presence of a competitive antagonist or desensitization. Curve C may
also represent an agonist with a lower receptor affinity (Ka
) or potency
than curve B. Curve A represents an agonist with higher receptor affinity or potency
than curve B.