|
|
|
|
|
|
|
|
|
|
|
|
|
|
|
The distribution of a drug throughout the plasma and tissues can
be viewed as a process of dilution from the highly concentrated solution in the syringe
to the dilute concentration in the plasma. This dilution results from mixing of
a drug into a larger volume. The pharmacokinetic concept of volume is the apparent
size of the tank required to explain the observed drug concentration. Figure
3-1
shows the dilution of administered drug into a tank of fluid. By definition,
the concentration in the tank is the amount of drug administered divided by the volume
of the tank. If we do not know the volume beforehand but can measure the concentration,
we can rearrange the definition of concentration to ascertain the volume of the tank:
When the volume of the tank is known, the concentration after any bolus of drug can be calculated as the dose divided by the volume. Just as the tank has a volume with or without drug in it, the volume of distribution of a particular drug is an intrinsic property of the individual with or without drug administration. Unlike the tank in
 Figure 3-1
Volume represents the dilution of drug from the more
concentrated form in the syringe to the dilute form in the blood.
Figure 3-1
Volume represents the dilution of drug from the more
concentrated form in the syringe to the dilute form in the blood.
If we assume that the drug is injected into an arm vein and that the initial concentration is measured in an artery, the central volume of distribution reflects the volume of the heart and great vessels and the venous volume of the upper arm. It also reflects drug uptake by the lungs. For example, alfentanil is less lipophilic than fentanyl or sufentanil, resulting in less pulmonary uptake of alfentanil than fentanyl or sufentanil. This characteristic results in a smaller central volume for alfentanil than fentanyl or sufentanil. The central volume also reflects any metabolism that occurs between the venous injection site and the arterial sample.
Of the pharmacokinetic concepts introduced in this chapter, the central volume of distribution is the most problematic. The concept is based on an incorrect notion that the plasma concentration after bolus injection instantaneously mixes in this volume, resulting in an instantaneous peak at the moment of injection. However, mixing is not instantaneous, and at the moment of intravenous injection, the arterial drug concentration is 0. The peak concentration is usually seen within 30 to 40 seconds of the injection. This 30- to 40-second delay is of no consequence for most therapeutics outside of anesthesia, but within the field of anesthesia, the pharmacokinetic determinants of anesthetic induction are clinically important. The mathematics of the true time course, including the time delay and recirculatory peaks, have been worked out in detail and are shown in Figure 3-2 .[1]
Despite the assumption of instantaneous mixing, the concept of central volume of distribution is useful. The central volume represents the backward (and upward) extrapolation of the concentration versus time curve from its peak at about 30 seconds to the y axis. It can be thought of as the initial concentration if circulation had been infinitely fast. Because of this backward extrapolation, estimates of the central volume are highly influenced by study design. A study with arterial samples has higher initial concentrations and therefore estimates a smaller central volume than a study with venous samples. The timing of blood samples also influences the central volume of distribution. Over the first 2 or 3 minutes after bolus injection, the concentration of anesthetic drugs falls very rapidly. If the first sample is drawn at 30 seconds, the backward extrapolation of the concentration versus time curve to the y axis predicts a high concentration at time 0 and a small central volume. If the first sample is drawn at 5 minutes, the backward extrapolation of the concentration versus time curve to the y axis predicts a much lower concentration and a larger central volume.
Anesthetic drugs distribute extensively into peripheral tissues. This distribution into the periphery is represented pharmacokinetically as additional volumes of distribution that are attached to the central volume. Peripheral volumes are linked to the central compartment (i.e., plasma) by blood flow, a process called intercompartmental clearance.
 Figure 3-2
A recirculatory model accounting for cardiac output (C.O.),
transit delays and pulmonary uptake (Delay elements VC
), and nondistributive
mixing pathways (VND
and CIND
). All components within the
dashed circle are required to accurately model the
central volume of distribution. In most situations, this complexity is not required,
and the simpler approach of assuming instantaneous mixing within the central volume
is an adequate approximation. CIND-F
and CIND-S
, fast and
slow nondistributive clearances; CIT-F
and CIT-S
, fast and
slow tissue clearances; VND-F
and VND-S
, fast and slow nondistributive
volumes; VT-F
and VT-S
, fast and slow tissue volumes. (From
Krejcie TC, Avram MJ, Gentry WB, et al: A recirculatory model of the pulmonary uptake
and pharmacokinetics of lidocaine based on analysis of arterial and mixed venous
data from dogs. J Pharmacokinet Biopharm 25:169–190, 1997.)
Figure 3-2
A recirculatory model accounting for cardiac output (C.O.),
transit delays and pulmonary uptake (Delay elements VC
), and nondistributive
mixing pathways (VND
and CIND
). All components within the
dashed circle are required to accurately model the
central volume of distribution. In most situations, this complexity is not required,
and the simpler approach of assuming instantaneous mixing within the central volume
is an adequate approximation. CIND-F
and CIND-S
, fast and
slow nondistributive clearances; CIT-F
and CIT-S
, fast and
slow tissue clearances; VND-F
and VND-S
, fast and slow nondistributive
volumes; VT-F
and VT-S
, fast and slow tissue volumes. (From
Krejcie TC, Avram MJ, Gentry WB, et al: A recirculatory model of the pulmonary uptake
and pharmacokinetics of lidocaine based on analysis of arterial and mixed venous
data from dogs. J Pharmacokinet Biopharm 25:169–190, 1997.)
The size of the peripheral volumes of distribution reflects the drug's solubility in tissue relative to blood or plasma. The more soluble a drug is in peripheral tissues relative to blood or plasma, the larger are the peripheral volumes of distribution. Because the tissue solubility of a drug depends on simple physiochemical constants, it would seem likely that peripheral volumes of distribution would be consistent from person to person. However, differences in body habitus and composition influence peripheral volumes of distribution.
Peripheral volumes of distribution explain the apparent dilution of the drug into all body tissues. We usually do not know the actual solubility of drugs in peripheral tissues. For the purpose of calculating drug dosage, a small mass of tissue with high solubility for the drug is indistinguishable from a large mass of tissue with low solubility. The convention in pharmacokinetics is to assume that the solubility of the drug in tissue is the same as the solubility in plasma. This assumption does not compromise the role of peripheral compartments to characterize the dilution of drugs into tissues, but it does lead to very large volumes of distribution for highly soluble drugs (e.g., 5000 L for propofol).
The volume of distribution at steady state is the volume that relates the plasma drug concentration at steady state (i.e., during a very long infusion) to the total amount of drug in the body. By rearranging the definition of concentration, we can calculate the volume of distribution at steady state as the total amount of drug in the body at steady state divided by the plasma drug concentration. The volume of distribution at steady state equals the central volume plus the peripheral volumes.
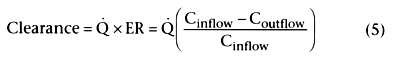
Clearance is the process that removes drug from a volume. Systemic clearance permanently removes drug from the body by elimination or by transforming it into metabolites. Intercompartmental clearance moves drug from the plasma into peripheral tissues. Clearance is defined as the volume that is completely cleared of drug per unit of time. The units of clearance are therefore units of flow: volume per unit time (e.g., liters per minute). Clearance is most
 Figure 3-3
Clearance represents the flow of blood or plasma that
is completely cleared of drug. If all of the drug is extracted by the clearing organ
(i.e., extraction ratio ≅ 1), clearance is the flow to the organ, as illustrated
here. (Adapted from Shafer S: Principles of pharmacokinetics and pharmacodynamics.
In Longnecker DE, Tinker JH, Morgan GE [eds]: Principles
and Practice of Anesthesiology, 2nd ed. St. Louis, Mosby-Year Book, 1997.)
Figure 3-3
Clearance represents the flow of blood or plasma that
is completely cleared of drug. If all of the drug is extracted by the clearing organ
(i.e., extraction ratio ≅ 1), clearance is the flow to the organ, as illustrated
here. (Adapted from Shafer S: Principles of pharmacokinetics and pharmacodynamics.
In Longnecker DE, Tinker JH, Morgan GE [eds]: Principles
and Practice of Anesthesiology, 2nd ed. St. Louis, Mosby-Year Book, 1997.)
Many drugs are cleared by hepatic biotransformation. The synthetic pathways for biotransformation are covered in detail in many biochemistry texts. Briefly, the liver metabolizes drugs through oxidation, reduction, hydrolysis, or conjugation. Oxidation and reduction occur in the cytochrome P450 system. These enzymes can be induced by exposure to certain drugs, increasing the liver's intrinsic metabolic capacity. Drugs or hepatic disease can also inhibit them. Routes of oxidative metabolism include hydroxylation, dealkylation, deamination, desulfuration, epoxidation, and dehalogenation. Conjugation and hydrolysis often occur outside of the P450 system, although glucuronidation involves the P450 system as well. The effect of conjugation is to transform hydrophobic molecules into water-soluble molecules through addition of polar groups and render the metabolites easier to excrete by the kidneys. The metabolites generated by the liver are generally inactive, although some drugs (e.g., morphine, midazolam) have metabolites that are as potent as the parent drug. Genetic polymorphism can occur in all of these pathways, and this accounts for part of the variability in clearance in the population, as discussed in the last section of this chapter.
Systemic clearance of anesthetic drugs generally occurs by means of hepatic metabolism, although other mechanisms include plasma and tissue ester hydrolysis (e.g., remifentanil, succinylcholine, esmolol), renal elimination (e.g., pancuronium), and nonspecific, "extrahepatic" metabolism for drugs whose clearance exceeds hepatic blood flow (e.g., propofol). The relationship between metabolism and clearance is complex. The following exploration of this relationship assumes hepatic metabolism, although the principles apply to the metabolism of drug in any tissue.
The rate of metabolism for most anesthetic drugs is proportional to the concentration of drug flowing into the liver. This means that metabolic clearance is constant and independent of dose. This is such a common and fundamental assumption for anesthetic pharmacokinetics that we explore the conditions that must be satisfied for it to be valid.
It cannot be true that metabolism is always proportional to concentration
because the metabolic capacity of the liver is not infinite. At some rate of drug
flow into the liver, the metabolic capacity becomes saturated, and the pharmacokinetic
equations cease to behave in a linear manner. To understand the rate of metabolism
quantitatively, we start with a simple observation of mass balance: The rate at
which drug flows out of the liver must be the rate
at which drug flows into the liver minus the rate
of metabolism. The rate at which drug flows into the liver is liver blood flow,
![]() , times the concentration of drug flowing in, Cinflow
. The rate
at which drug flows out of the liver is liver blood flow,
, times the concentration of drug flowing in, Cinflow
. The rate
at which drug flows out of the liver is liver blood flow, ![]() , times the concentration
of drug flowing out, Coutflow
. Putting this together, the rate of hepatic
metabolism by the liver, R, is the difference between the drug concentration flowing
into the liver and the drug concentration flowing out of the liver times the rate
of liver blood flow:
, times the concentration
of drug flowing out, Coutflow
. Putting this together, the rate of hepatic
metabolism by the liver, R, is the difference between the drug concentration flowing
into the liver and the drug concentration flowing out of the liver times the rate
of liver blood flow:
Rate of drug metabolism = R = ![]() (Cinflow
− Coutflow
) (2)
(Cinflow
− Coutflow
) (2)
This relationship is illustrated in Figure
3-4
. Because hepatic metabolism does not have infinite capacity, the relationship
between the rate of hepatic metabolism, R, and concentration must be saturable.
We are carefully inspecting the saturation equation because it shows up repeatedly
in pharmacokinetics and pharmacodynamics:
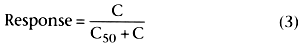
Response in Equation 3 varies from 0 to 1, depending on the value of C. When C is
0, the response is 0. If C is greater than 0 but much less than C50
,
the response is nearly proportional to C (response ![]() C / C50
).
If C equals C50
, the response is C50
/ C50
+
C50
,
which is 0.5. This is where the term C50
comes from; it is the concentration associated with a 50% response. As C becomes
much greater
C / C50
).
If C equals C50
, the response is C50
/ C50
+
C50
,
which is 0.5. This is where the term C50
comes from; it is the concentration associated with a 50% response. As C becomes
much greater
 Figure 3-4
The rate of metabolism can be computed as the rate of
liver blood flow times the difference between the inflowing and outflowing drug concentrations.
This is a common approach to analyzing metabolism or tissue uptake across an organ
in mass-balance pharmacokinetic studies.
Figure 3-4
The rate of metabolism can be computed as the rate of
liver blood flow times the difference between the inflowing and outflowing drug concentrations.
This is a common approach to analyzing metabolism or tissue uptake across an organ
in mass-balance pharmacokinetic studies.
We can model the relationship between hepatic metabolism and drug concentration using this equation for saturation. What concentration determines the rate of metabolism: the concentration flowing into the liver, the average concentration within the liver, or the concentration flowing out of the liver? All three have been used, but the most widely used model of metabolism views the rate of metabolism as a function of the concentration flowing out of the liver, Coutflow . This topic is discussed extensively by Wagner.[3]
We can expand our equation of metabolism to include the observation that the rate of metabolism, R, approaches
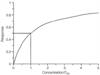 Figure 3-5
The saturation equation, response =
C/(C50
+ C), shows the decreasing incremental response
as the system approaches saturation. Variations of this equation show up repeatedly
in pharmacokinetics and pharmacodynamics.
Figure 3-5
The saturation equation, response =
C/(C50
+ C), shows the decreasing incremental response
as the system approaches saturation. Variations of this equation show up repeatedly
in pharmacokinetics and pharmacodynamics.
We have talked about the rate of metabolism but not about hepatic
clearance. If the liver could completely extract the drug from the afferent flow,
clearance would equal liver blood flow (![]() ). However, the liver cannot
). However, the liver cannot
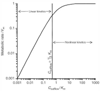 Figure 3-6
The relationship between concentration, expressed as
a fraction of Km
(Michaelis constant), and drug metabolism, expressed
as a fraction of Vm
(maximum rate). As long as the outflow concentration
is less than one-half Km
, a change in concentration is matched by a proportional
change in metabolic rate. This is true of nearly all anesthetic drugs. (Adapted
from Shafer S: Principles of pharmacokinetics and pharmacodynamics. In
Longnecker DE, Tinker JH, Morgan GE [eds]: Principles and Practice of Anesthesiology,
2nd ed. St. Louis, Mosby-Year Book, 1997.)
Figure 3-6
The relationship between concentration, expressed as
a fraction of Km
(Michaelis constant), and drug metabolism, expressed
as a fraction of Vm
(maximum rate). As long as the outflow concentration
is less than one-half Km
, a change in concentration is matched by a proportional
change in metabolic rate. This is true of nearly all anesthetic drugs. (Adapted
from Shafer S: Principles of pharmacokinetics and pharmacodynamics. In
Longnecker DE, Tinker JH, Morgan GE [eds]: Principles and Practice of Anesthesiology,
2nd ed. St. Louis, Mosby-Year Book, 1997.)
Consider the first term that is equal to clearance: 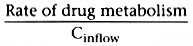
.
This indicates that clearance is a proportionality constant that relates arterial
concentration to the rate of metabolism. If we want to maintain a given steady-state
arterial drug concentration, drug must be infused at the same rate that it is being
metabolized. The infusion rate to maintain a given arterial concentration is clearance
times the desired arterial concentration.
Consider the third and fourth terms that are equal to clearance:

and 
.
Taken together, these equations relate clearance to liver blood flow and the extraction
ratio[4]
( Fig.
3-7
). For drugs with an extraction ratio of nearly 1 (e.g., propofol),
a change in liver blood flow produces a nearly proportional change in clearance.
For drugs with a low extraction ratio (e.g., alfentanil), clearance is nearly independent
of the rate of liver blood flow. This makes intuitive sense. If nearly 100% of
the drug is extracted by the liver, it implies that the liver has tremendous metabolic
capacity for the drug. In this case, the rate-limiting step in metabolism is the
flow of drug to the liver, and such drugs are said to be flow
limited. Any reduction in liver blood flow, such as usually accompanies
anesthesia, can be expected to reduce clearance. However, moderate changes in hepatic
metabolic function have little impact on clearance because hepatic metabolic capacity
is overwhelmingly in excess of demand.
For many drugs (e.g., alfentanil), the extraction ratio is considerably less than 1. For these drugs, clearance is limited by the capacity of the liver to take up and metabolize the drug. These drugs are said to be capacity limited. Clearance changes in response to any change in the capacity of the liver to metabolize such drugs, as can be caused by liver disease or enzymatic induction. However, changes in liver blood flow, as can be caused by the anesthetic state itself, usually have little influence on the clearance because the liver handles only a fraction of the drug it makes contact with.
The last two components of equation can also be used to show how the extraction ratio governs the response of clearance to changes in metabolic capacity (Vm ). Figure 3-8 shows the clearance for drugs with an extraction ratio ranging from 0.1 to 1, based on a liver blood flow of 1.4 L/min. The extraction ratios were calculated for a Vm = 1. Changes in Vm , which can be caused by liver disease (i.e., reduced Vm ) or enzymatic induction (i.e., increased Vm ), have little effect on drugs with a high extraction ratio. However, drugs with a low extraction ratio have a nearly linear change in clearance with a change in intrinsic metabolic capacity (Vm ).
Because Vm
and Km
are often unknown, it
is occasionally useful to condense them into a single term that summarizes the hepatic
metabolic capacity, the intrinsic clearance. Returning
to the observation that 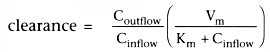
, consider
what happens if hepatic blood flow increases to infinity with no change in hepatic
metabolic capacity. Coutflow
becomes indistinguishable from Cinflow
,
because the finite hepatic capacity metabolizes only an infinitesimal fraction of
the drug flowing through the liver. As a result, clearance becomes 
.
We can solve for this in the linear range by finding
clearance when
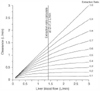 Figure 3-7
Relationships among liver blood flow (Q), clearance,
and the extraction ratio. For drugs with a high extraction ratio, clearance is nearly
identical to liver blood flow. For drugs with a low extraction ratio, changes in
liver blood flow have almost no effect on clearance. (Adapted from Wilkinson
GR, Shand DG: Comentary: A physiological approach to hepatic drug clearance. Clin
Pharmacol Ther 18:377–390, 1975.)
Figure 3-7
Relationships among liver blood flow (Q), clearance,
and the extraction ratio. For drugs with a high extraction ratio, clearance is nearly
identical to liver blood flow. For drugs with a low extraction ratio, changes in
liver blood flow have almost no effect on clearance. (Adapted from Wilkinson
GR, Shand DG: Comentary: A physiological approach to hepatic drug clearance. Clin
Pharmacol Ther 18:377–390, 1975.)
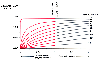 Figure 3-8
Corollary to Figure
3-7
, showing the relationships among metabolic capacity, clearance, and
the extraction ratio (E.R.). Changes in maximum metabolic velocity (Vm
)
have little effect on drugs with a high extraction ratio, but they cause a nearly
proportional decrease in clearance of drugs with a low extraction ratio.
Figure 3-8
Corollary to Figure
3-7
, showing the relationships among metabolic capacity, clearance, and
the extraction ratio (E.R.). Changes in maximum metabolic velocity (Vm
)
have little effect on drugs with a high extraction ratio, but they cause a nearly
proportional decrease in clearance of drugs with a low extraction ratio.
The relationship between intrinsic clearance and extraction ratio is shown in Figure 3-9 , calculated at a hepatic blood flow of 1400 mL/min. In general, true hepatic clearance and extraction ratio are more useful concepts for anesthetic drugs than the intrinsic clearance. However, intrinsic clearance is introduced here because it is occasionally used in pharmacokinetic analyses of anesthetic drugs.
We have been focusing on linear pharmacokinetics, the pharmacokinetics of drugs whose metabolic rate at clinical doses is less than Vm /3. The clearance of such drugs is generally expressed as a constant (e.g., propofol clearance = 1.6 L/min). Some drugs, such as phenytoin, exhibit saturable pharmacokinetics; they have such low Vm values that typical doses exceed the linear portion of Figure 3-6 . The clearance of drugs with saturable metabolism is a function of drug concentration, rather than a constant.
The kidneys clear drug from plasma by filtration at the glomerulus
and direct transport into the tubules. Renal blood flow is inversely correlated
with age, as is creatinine clearance, which can be predicted from age and weight
according to the equation of Cockroft and Gault[5]
:
Men:
Women:
85% of the value for men
 Figure 3-9
The relationship between intrinsic clearance and extraction
ratio is calculated for a liver blood flow of 1400 mL/min.
Figure 3-9
The relationship between intrinsic clearance and extraction
ratio is calculated for a liver blood flow of 1400 mL/min.
Equation 9 shows that age is an independent factor in predicting creatinine clearance. Elderly people have decreased creatinine clearance, even in the presence of normal serum creatinine levels. Inhaled anesthetics also decrease renal blood flow. Decreased renal clearance delays the offset of effect for renally excreted drugs. For instance, pancuronium is about 85% cleared by the kidneys. The dose of pancuronium should be reduced in elderly patients on the basis of decreased clearance, even though they may have normal serum creatinine levels.
In some cases, anesthetic drugs are cleared in tissues, including blood, muscle, and lungs. For example, remifentanil is cleared by nonspecific esterases located primarily in muscle and intestines, but the lungs, liver, kidneys, and blood contribute minimally to remifentanil clearance. Succinylcholine, mivacurium, and 2-chloroprocaine are metabolized by plasma butyrylcholinesterases (formerly designated pseudocholinesterases). The half-life of succinylcholine, mivacurium, and 2-chloroprocaine in plasma is about 3 minutes, 5 minutes, and 25 seconds, respectively. About one half of atracurium's metabolism is hepatic, and the balance occurs in blood by means of nonspecific cholinesterases (but not by butyrylcholinesterases). Hofmann degradation is a spontaneous process in plasma at normal pH and temperature and does not depend on circulating esterases. Hofmann degradation is a minor route of atracurium metabolism, but it is the major route of metabolism of cisatracurium, an isomer of atracurium. This is an important distinction; unlike atracurium and mivacurium, cisatracurium metabolism is unaffected by disease or genetic variants of cholinesterase metabolism.
Clearance by tissues other than blood can be analyzed using models similar to those for hepatic clearance. Tissue clearance can be flow limited or capacity limited, or both. Clearance within the blood itself cannot be flow limited and therefore depends entirely on the intrinsic metabolic rate and capacity within the blood.
Distribution clearance is the transfer of drug between the blood or plasma and the peripheral tissues. Unlike metabolic clearance, distribution clearance does not permanently remove drug from the body. Distribution clearance is a function of cardiac output, tissue blood flow, and the permeability of the capillary walls to the drug. For a drug that readily crosses into peripheral tissues, such as propofol, the sum of the metabolic clearance and the distribution clearance approaches cardiac output. For drugs such as succinylcholine and remifentanil that are metabolized directly in the plasma or in many peripheral tissues, the sum of metabolic clearance and distribution clearance can exceed cardiac output.
Many drugs are bound to plasma proteins, particularly to albumin
and α1
-acid glycoprotein. The relationship between drugs and their
binding proteins can be described as follows:
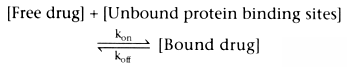
In this reversible reaction, [Free drug] is the free drug concentration, [Unbound
protein binding sites] is the concentration of the available unbound protein binding
sites, [Bound drug] is the concentration of drug bound to plasma proteins, kon
is the rate constant for binding of drug to plasma protein, and koff
is
the rate constant for dissociation of bound drug from the plasma proteins. From
this relationship, it can be inferred that the rate of formation of bound drug is
as follows:
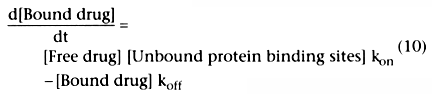
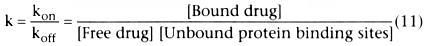
At equilibrium (which is nearly instantaneous), d[Bound drug]/dt =
0, permitting us to solve for k, the ratio of kon
/koff
:
Plasma proteins may have more than one binding site. The total number of binding
sites is the protein concentration, [Protein], times n, the average number of binding
sites per protein molecule. For all of the drugs used in anesthesia, the number
of binding sites bound is only a trivial fraction of the total available binding
sites, and it is possible to reasonably approximate [Unbound protein binding sites]
by n [Protein]. Because the number of binding sites per molecule, n, is constant,
we can fold it into the rate constant, k, by defining the association constant, Ka
,
as follows:
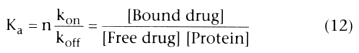
We can define fu
as the free fraction of drug:
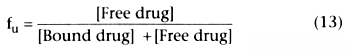
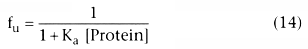
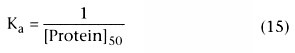
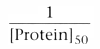
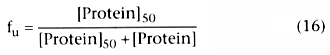
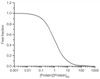 Figure 3-10
Relationship between plasma protein concentration as
a fraction of the concentration associated with 50% binding and the fraction of drug
that is unbound. This is another example of the saturation equation illustrated
in Figure 3-5
.
Figure 3-10
Relationship between plasma protein concentration as
a fraction of the concentration associated with 50% binding and the fraction of drug
that is unbound. This is another example of the saturation equation illustrated
in Figure 3-5
.
The association constant, Ka , and its inverse, [Protein]50 , reflect the affinity of the drug for plasma proteins. They should not change in the presence of disease. However, [Protein] can change with disease, age, or concurrent drugs. Figure 3-11 shows the relationship between changes in protein concentration and changes in the free fraction of drug for drugs with different degrees of protein binding in the normal clinical use. The lines on the graph correspond to different drugs whose free fraction in normal plasma ranges from 1.0 (horizontal line) to approximately 0.0 (straight diagonal line).
For drugs that are not bound (free fraction = 1.0), there is no relationship between free fraction and protein concentration, as indicated by the horizontal line. For drugs whose free fraction is typically 90%, there is a small change in free drug concentration with changes in protein concentration. For drugs that are highly protein bound, the free drug concentration changes nearly inversely with the change in protein concentration. As the percentage of binding approaches 100% (free drug → 0.0), the relationship between change in protein concentration and change in free fraction becomes inversely proportional. There is never a greater than proportional change in free drug concentration with a change in plasma concentration. For example, the most that a 10% change in protein concentration would produce is a 10% change in free drug concentration, and that would be the case only if the drug were nearly 100% bound to plasma proteins.
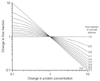 Figure 3-11
The relationship between changes in protein concentration
and changes in free fraction depends on the free fraction in normal plasma with typical
clinical doses. For a drug that is not bound (free fraction ≅ 1), there is no
change in free fraction with a change in protein concentration. For a highly bound
drug with a free fraction that is nearly 0, any change in protein causes a nearly
inversely proportional change in free fraction. (Adapted from Shafer S:
Principles of pharmacokinetics and pharmacodynamics. In
Longnecker DE, Tinker JH, Morgan GE [eds]: Principles and Practice of Anesthesiology,
2nd ed. St. Louis, Mosby-Year Book, 1997.)
Figure 3-11
The relationship between changes in protein concentration
and changes in free fraction depends on the free fraction in normal plasma with typical
clinical doses. For a drug that is not bound (free fraction ≅ 1), there is no
change in free fraction with a change in protein concentration. For a highly bound
drug with a free fraction that is nearly 0, any change in protein causes a nearly
inversely proportional change in free fraction. (Adapted from Shafer S:
Principles of pharmacokinetics and pharmacodynamics. In
Longnecker DE, Tinker JH, Morgan GE [eds]: Principles and Practice of Anesthesiology,
2nd ed. St. Louis, Mosby-Year Book, 1997.)
The in vitro observation that changing the protein concentration results in changing the free drug concentration (see Fig. 3-11 ) does not necessarily apply to the in vivo situation. It is the free (i.e., unbound) drug that equilibrates between the plasma and the tissues. If protein binding decreases, the free drug concentration gradient between the plasma and peripheral tissues increases. As a result, when protein binding decreases, equilibrium is achieved between the plasma and the tissue free drug concentrations at a lower total plasma drug concentration. This lower concentration gives the appearance that the drug has distributed into a larger total space. Decreased protein binding causes an increase in the apparent volume of distribution when referenced to total, rather than free, drug concentration.
This explains why the increased volume of distribution at steady state seen with decreased plasma protein binding is mostly an illusion. If only the unbound drug concentration were measured, there would be almost no change in the apparent volume of distribution of lipophilic drugs (i.e., most of those in anesthesia practice), because it is the partitioning of drug within peripheral tissues that primarily governs the free concentration of lipophilic drugs.
Changes in protein binding may affect the clearance of drugs. If a drug has a high extraction ratio, the liver is going to remove nearly all the drug flowing to it, regardless of the extent of protein binding. However, if the drug has a low hepatic extraction ratio, an increase in the free fraction of drug results in an increase in the driving gradient, with an associated increase in clearance. Protein binding also affects the apparent potency of a drug when referenced to the total plasma drug concentration. An increase in the free fraction increases the driving pressure to the site of drug effect. A change in the free fraction increases the concentration at the effect site. Because of this change in apparent potency, decreased protein binding may decrease the dose required to produce a given drug effect, even in the absence of pharmacokinetic changes.
Typical pharmacokinetic analyses describe fictitious drugs. For example, the pharmacokinetics and pharmacodynamics of thiopental, fentanyl, and midazolam describe drugs that do not exist. The reason is that most anesthetic drugs are chiral and are supplied as racemic mixtures. The body is a chiral environment, and drugs interact stereospecifically with enzymes, proteins, and receptors. The pharmacokinetics and pharmacodynamics of the enantiomers may differ. The enantiomers of bupivacaine and ketamine have been particularly well studied, and the levo isomer of bupivacaine, levobupivacaine, is commercially available. Although the importance of studying the pharmacokinetics and pharmacodynamics of individual stereoisomers is widely appreciated, the difficulty of doing such studies has precluded widespread use.
|
|
|
|
|
|
|
|
|
|
|
|
|