Pharmacogenetics of Drug Metabolism
Although CYPs are most often thought of as being responsible for
the deactivation of toxic compounds, they are
also responsible for the metabolic activation of drugs and chemicals to toxic forms.
Any factor that can influence metabolism has the potential to affect toxicity.
Drug biotransformation may be affected by many factors, including route of administration,
frequency of administration, exposure to other chemicals, sex, age, diet, and genetics.
The concept of pharmacogenetics originated from
the clinical observation that there were patients with very low or very high plasma
or urinary drug levels, followed by the realization that the biochemical traits leading
to this variation were inherited. Soon thereafter, drug-metabolizing enzymes were
identified, followed by discovery of the genes encoding the proteins and the DNA
sequences within the genes. Most of the early pharmacogenetic traits were monogenic,
involving a single gene, and most were caused by genetic polymorphism.
The discovery that impairment in the phase 1 hydrolysis of succinylcholine
by butyrylcholinesterase was inherited served as an early stimulus for the development
of pharmacogenetics. About 1 in 3500 whites are homozygous for a gene encoding an
atypical form of butyrylcholinesterase. These individuals have less ability to hydrolyze
succinylcholine, prolonging the neuromuscular-blocking effects of this drug.[19]
[20]
Other studies demonstrate that the CYP2D6
enzyme
represents one of the best understood examples of pharmacogenetic variation in drug
metabolism. Substrates for CYP2D6 include codeine, metoprolol, nortriptyline, dextromethorphan,
debrisoquin, and sparteine.[21]
Approximately 5%
to 10% of white subjects were found to be deficient in their ability to metabolize
the antihypertensive drug debrisoquin[21]
and the
antiarrhythmic drug sparteine,[22]
which resulted
in low levels of urinary metabolites and high plasma concentrations of the parent
compounds. These deficiencies are inherited as an autosomal recessive trait.[22]
[23]
The cDNA for the gene encoding CYP2D6 has
been
cloned, and a number of genetic variants responsible for the deficient activities
of CYP2D6 have been identified. Other subjects have multiple copies of active forms
of CYP2D6 that result in rapid elimination of drugs, leading to subtherapeutic levels.
Such is the case for the antidepressant nortriptyline ( Fig.
8-3
). There exist many other examples of poor metabolizers of drugs who
have genetic variants of other CYP isoforms. For example, CYP2C9 variants can lead
to the poor metabolism of warfarin and phenytoin and subsequent toxic levels of these
compounds. Similarly, polymorphisms in the phase 2 metabolizing enzyme N-acetyltransferase
(NAT) can lead to bimodal differences in the N-acetylation
and inactivation of the antituberculosis drug isoniazid ( Fig.
8-4
). Molecular cloning studies have shown that there are two NAT genes
in humans, NAT1 and NAT2,
and the common genotypic polymorphism responsible for the pharmacogenetic variation
in isoniazid metabolism involves the NAT2 gene.[24]
The frequency of each acetylation phenotype depends on race but not sex or age.
Fast acetylation is found in Inuit and Japanese, and slow acetylation predominates
among Scandinavians and North African whites.[25]
Another example of the role of genetics in phase 2 metabolism concerns the antineoplastic
drug azathioprine, a prodrug that is converted into the active drug, 6-mercaptopurine.
Thiopurines such as
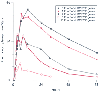 Figure 8-3
Pharmacogenetics of nortriptyline. Mean plasma concentrations
of nortriptyline after a single 25-mg oral dose are shown in subjects with 0, 1,
2, 3, or 13 functional CYP2D6 genes. (Adapted
from Weinshilboum R: Inheritance and drug response. N Engl J Med 348:529–537,
2003.)
Figure 8-3
Pharmacogenetics of nortriptyline. Mean plasma concentrations
of nortriptyline after a single 25-mg oral dose are shown in subjects with 0, 1,
2, 3, or 13 functional CYP2D6 genes. (Adapted
from Weinshilboum R: Inheritance and drug response. N Engl J Med 348:529–537,
2003.)
6-mercaptopurine are metabolized by thiopurine S-methyltransferase
(TPMT).[26]
[27]
This enzymatic activity is inherited in an autosomal codominant fashion. Individuals
who are homozygous for alleles encoding inactive TPMT and are receiving standard
doses of azathioprine are at risk of developing severe pancytopenia.
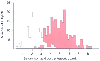 Figure 8-4
Bimodal distribution of serum isoniazid concentrations
in a large group of Finnish patients. More than 300 patients were given intravenous
injections of 5 mg/kg of isoniazid. Serum drug concentrations were assayed at multiple
times after injection. The distribution of serum concentrations of isoniazid is
shown for 180 minutes after injection. The red histogram represents rapid inactivators,
and the white histogram represents slow inactivators. (From Petri WA Jr:
Antimicrobial agents: Drugs used in the chemotherapy of tuberculosis, Mycobacterium
complex disease and leprosy. In Hardman JG, Limbird
LE, Goodman GA [eds]: Goodman and Gillman's the Pharmacological Basis of Therapeutics,
10th ed. New York, McGraw-Hill, 2001.)
Figure 8-4
Bimodal distribution of serum isoniazid concentrations
in a large group of Finnish patients. More than 300 patients were given intravenous
injections of 5 mg/kg of isoniazid. Serum drug concentrations were assayed at multiple
times after injection. The distribution of serum concentrations of isoniazid is
shown for 180 minutes after injection. The red histogram represents rapid inactivators,
and the white histogram represents slow inactivators. (From Petri WA Jr:
Antimicrobial agents: Drugs used in the chemotherapy of tuberculosis, Mycobacterium
complex disease and leprosy. In Hardman JG, Limbird
LE, Goodman GA [eds]: Goodman and Gillman's the Pharmacological Basis of Therapeutics,
10th ed. New York, McGraw-Hill, 2001.)