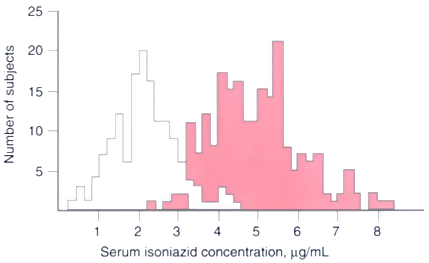
Figure 8-4
Bimodal distribution of serum isoniazid concentrations
in a large group of Finnish patients. More than 300 patients were given intravenous
injections of 5 mg/kg of isoniazid. Serum drug concentrations were assayed at multiple
times after injection. The distribution of serum concentrations of isoniazid is
shown for 180 minutes after injection. The red histogram represents rapid inactivators,
and the white histogram represents slow inactivators. (From Petri WA Jr:
Antimicrobial agents: Drugs used in the chemotherapy of tuberculosis, Mycobacterium
complex disease and leprosy. In Hardman JG, Limbird
LE, Goodman GA [eds]: Goodman and Gillman's the Pharmacological Basis of Therapeutics,
10th ed. New York, McGraw-Hill, 2001.)

