 |
 |
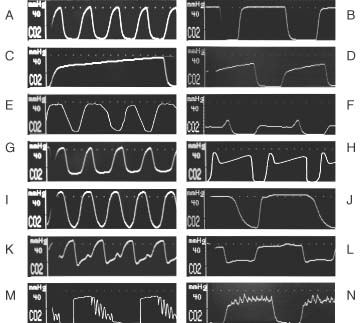
Figure 36-18
Examples of capnograph waves. A,
Normal spontaneous breathing. B, Normal mechanical
ventilation. C, Prolonged exhalation during spontaneous
breathing. As CO2
diffuses from the mixed venous blood into the alveoli,
its concentration progressively rises (see Fig.
36-19
). D, Increased slope of phase III
in a mechanically ventilated patient with emphysema. E,
Added dead space during spontaneous ventilation. F,
Dual plateau (i.e. tails-up pattern) caused by a leak in the sample line.[325]
The alveolar plateau is artifactually low because of dilution of exhaled gas with
air leaking inward. During each mechanical breath, the leak is reduced because of
higher pressure within the airway and tubing, explaining the rise in the CO2
concentration at the end of the alveolar plateau. This pattern is not seen during
spontaneous ventilation because the required increase in airway pressure is absent.
G, Exhausted CO2
absorbent produces an
inhaled CO2
concentration greater than zero. H,
Double peak for a patient with a single lung transplant. The first peak represents
CO2
from the transplanted (normal) lung. CO2
exhalation from
the remaining (obstructed) lung is delayed, producing the second peak. I,
Inspiratory valve stuck open during spontaneous breathing. Some backflow into the
inspired limb of the circuit causes a rise in the level of inspired CO2
J, Inspiratory valve stuck open during mechanical
ventilation. The "slurred" downslope during inspiration represents a small amount
of inspired CO2
in the inspired limb of the circuit. K
and L, Expiratory valve stuck open during spontaneous
breathing or mechanical ventilation. Inhalation of exhaled gas causes an increase
in inspired CO2
. M, Cardiogenic oscillations,
when seen, usually occur with sidestream capnographs for spontaneously breathing
patients at the end of each exhalation. Cardiac action causes to-and-fro movement
of the interface between exhaled and fresh gas. The CO2
concentration
in gas entering the sampling line therefore alternates between high and low values.
N, Electrical noise resulting from a malfunctioning
component. The seemingly random nature of the signal perturbations (about three
per second) implies a nonbiologic cause.

 |
