|
|
|
|
|
|
|
|
|
|
|
|
|
|
|
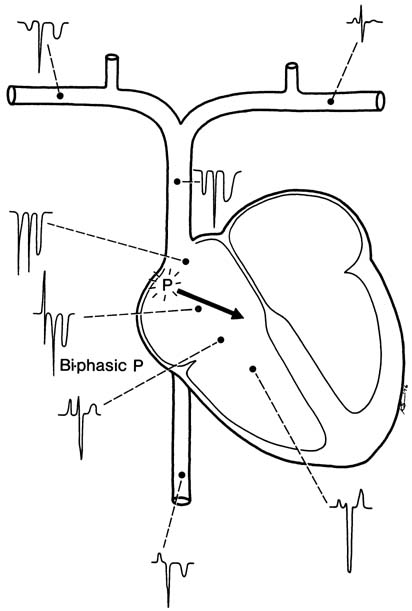
Figure 53-13
Electrocardiographic (ECG) configurations observed at
various locations when a central venous catheter is used as an intravascular ECG
electrode. The configurations in the figure will be observed when "lead II" is monitored
and the positive electrode (the leg electrode) is connected to the catheter. P indicates
the sinoatrial node. The heavy black arrow indicates
the P-wave vector. Note the equi-biphasic P wave when the catheter tip is in the
mid-right atrial position.[111]

|
|
|
|
|
|
|
|
|
|
|
|
|
|