APPENDIX 4: Amplification Artifact of a Fluid Tube/Transducer
Pressure
Wave
The amplification artifact of a fluid tube/transducer pressure
waveform can be calculated if a few properties of the system are known. The most
relevant part of this solution is the response amplitude, which is plotted against
the driving frequency (f) in Figure
30-14
. This figure shows some important properties of fluid-coupled transducers
and other harmonic oscillators. One of these properties is the existence of a resonant
frequency, f0
, which is defined as follows:
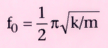
Remember, m is the mass of the system and k is the elasticity, or spring constant.
As we increase the amount of damping (i.e., friction; c is the
friction constant), we observe a decrease in the peak amplitude at resonance, and
the frequency at which the peak occurs decreases slightly. The damping coefficient
(z) is defined as follows:

Even though the arterial pressure waveform is not actually sinusoidal, Figure
30-14
shows the most important characteristics of the pressure transducer
response. Any combination of catheter, tubing, and transducer can be characterized
by two quantities: a resonant frequency (f0
) and a damping coefficient
(z). Gardner measured these quantities for many transducer and tubing systems and
found that most systems have resonant frequencies of 10 to 20 cycles/sec
or hertz (Hz) and damping coefficients of 0.2 to 0.3. For clinical systems, the
maximum amplification factor (the ratio of transducer output to input waveform amplitude)
at resonance is near 2.5.
If the resonant frequency is 10 Hz (600 cycles/min), one might
conclude that amplification plays little role in the clinical range of pulse rates,
which are 5 to 10 times smaller. However, the arterial pressure waveform is not
a sine wave. It can be represented as a summation of sine waves (a Fourier series)
with frequencies up to many times the pulse rate. It is these higher harmonic frequencies
that are amplified most and that yield the spiked appearance of a poorly processed
arterial waveform. Depending on the shape of the actual arterial pressure wave,
this distortion can introduce a 20% to 40% "overshoot" error in systolic blood pressure
readings. Even worse, this error is dependent on the pulse rate, so an error determined
for a particular patient at the beginning of administration of an anesthetic may
not remain constant.
From this discussion we can easily predict how to optimize the
performance of a pressure transducer system. First, the resonant frequency (f0
)
should be as high as possible. Therefore, the value for k in Equation 1 should be
large (i.e., the spring should be "stiff"), and the value for m should be small (i.e.,
the cannula and pressure tubing should be as stiff and inelastic as possible). To
minimize the mass of the moving fluid, the tubing should be short in length and small
in diameter. Judging from plots of amplitude versus frequency/resonant frequency
at different damping coefficients, the optimal damping coefficient would be 0.4 to
0.5. One should also carefully eliminate air bubbles from the system because they
add elasticity and friction, thereby lowering the resonant frequency. In a clinical
system, one can determine the approximate f0
and z of a transducer system
if graphic output is available. If the high-pressure flush is turned on and then
quickly off at a high chart speed (50 mm/sec), the tracing oscillates through several
cycles at a frequency near f0
. The damping coefficient can be found by
determining the ratio of amplitudes of successive peaks on the tracing. This is
a practical example of how fundamental principles of mechanics can be used to predict
and optimize the performance of monitoring systems. These concepts of mechanics
will recur in later sections of this chapter.
 |