A Simplified Benefit-Risk Analysis of Testing
The above analysis is only a cost-benefit and not a benefit-risk
analysis and therefore disregards the possible harm of unwarranted testing, which
in fact does incur risk ( Fig. 25-4
).
Let us assume that the chest radiograph in the under-age-40 population has a sensitivity
of 75% and a specificity of 95% (these values are better than the best in the literature
for readings referenced by a single radiologist). Let us also assume that the prevalence
of disease detectable by the test is 0.5%, that the benefit from true positives is
20 in 100 (better than the best in
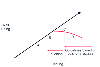 Figure 25-4
Theory and actuality of what happens to well-being as
testing increases. The straight line represents the common theory that "the more
testing, the better"; that is, that well-being increases with testing. The A-to-E
curve shows what actually happens as testing increases. At a certain point (point
C), more harm than good may result. Therefore, point C represents the optimal point
in the well-being versus testing relationship. The goal of using guidelines is to
direct resources from point E to point C (to reduce testing and to increase well-being).
Unless health-care providers allocate health resources in a cost-efficient manner,
governmental restrictions will move testing from point C to point A—that is,
will ration testing that improves well-being.
Figure 25-4
Theory and actuality of what happens to well-being as
testing increases. The straight line represents the common theory that "the more
testing, the better"; that is, that well-being increases with testing. The A-to-E
curve shows what actually happens as testing increases. At a certain point (point
C), more harm than good may result. Therefore, point C represents the optimal point
in the well-being versus testing relationship. The goal of using guidelines is to
direct resources from point E to point C (to reduce testing and to increase well-being).
Unless health-care providers allocate health resources in a cost-efficient manner,
governmental restrictions will move testing from point C to point A—that is,
will ration testing that improves well-being.
TABLE 25-11 -- Hypothetic benefit-risk analyses for two tests, under three circumstances
|
Test: |
Chest Radiograph |
Electrocardiogram |
|
Patient: |
<40-Year-Old Asymptomatic Patient (%) |
30-Year-Old-Asymptomatic Man, to Search
for MI |
47-Year-Old Asymptomatic Man, to Search
for MI and Conduction Disturbance |
|
Sensitivity of test |
75 |
33% |
50% |
|
Specificity of test |
95 |
90% |
90% |
|
Prevalence of disease detectable by test |
0.5 |
∼2.1% |
∼15% |
|
Benefit from true-positives |
20 |
20% |
20% |
|
Harm rate for false-positives |
6 |
6% |
6% |
|
Benefit per 1,000 patients |
|
|
|
|
Predicted true-positives |
3.8 |
7 |
75 |
|
Benefited patients |
0.8 |
1.4 |
15 |
|
Harm per 1,000 patients |
|
|
|
|
Predicted false-positives |
4.9 |
97.9 |
85 |
|
Harmed patients |
3 |
5.9 |
5.1 |
|
Conclusion: |
Harm greater than benefit: do not test! |
Benefit greater than harm:
test! |
|
MI, myocardial infarction. |
the literature)[110]
[111]
[112]
[113]
[114]
[115]
[116]
[117]
[118]
[119]
[120]
[121]
[122]
[123]
[124]
[125]
(see
Table 25-6
) (Apfelbaum JL
et al, unpublished data), and that harm from false-positive results is 6 in 100 (see
previous discussion)[82]
[149]
(Apfelbaum JL et al, unpublished data). For the asymptomatic under-age-40 population,
the result would be harm to three individuals and benefit to only 0.8 individuals
per 1,000 chest radiographs ( Table
25-11
). Similar analyses are possible for other tests and situations (see
Table 25-11
).