|
|
|
|
|
|
|
|
|
|
|
|
|
|
|
Over the past 20 years there have been a number of studies[44] [45] [46] [47] [48] [49] [50] [51] [52] [53] [54] [81] [96] [205] [206] [207] [208] [209] [210] of the anesthetist's intraoperative activities. In addition there has been an increasing amount of studies performed in realistic simulator environments.[2] [29] [80] [211] [212] [213] [214] [215] [216] [217] [218] [219] [220] [221] [222] [223] [224] [225] [226] [227] [228] Most of them are addressed in more detail in Chapter 84 on Patient Simulators.
The earliest studies used time-lapse photography of a handful of anesthetic cases with a frame-by-frame analysis of tasks. One major finding of the first task analysis, by Drui and associates in 1973,[100] was that "the anesthesiologist's attention was often directed away from the patient-surgical field." In subsequent studies,[105] [106] [107] [108] it was found that about 40 to 50 percent of the time, the anesthetist's gaze was directed away from the patient or surgical field. McDonald and Dzwonczyk,[103] studying cases from 1981, classified a direct patient activity as "one during which the anesthetist had contact with the patient and a view of the surgical field." These investigators explicitly noted "observation of skin color," "palpation of pulse," and "auscultation of heart and breath sounds" as direct patient activities. Observing the arterial pressure or ECG and observing or adjusting the anesthesia machine or intravenous infusions were classified as indirect patient activities. In this study, 83 percent of the anesthetist's time was spent on activities that were not direct patient activities. The same group[104] repeated its study in 1985 and demonstrated a much higher rate of direct patient monitoring than obtained in 1981 (44.8% versus 16.8%). This group attributed this difference to the change from manual ventilation in 1981, which took up much of the anesthetist's visual attention, to the use of mechanical ventilators in 1985, which freed the anesthetist to watch the patient.
It has become a truism that looking at the patient and at the surgical field is a hallmark of an excellent clinician. Opponents of technology decry the degree to which monitors and therapeutic devices distract the anesthetist's gaze from the patient. However, an important distinction has to be made between the anesthetist's attention, which surely must be directed to the patient's needs, and the anesthetist's gaze, which, in fact, may best serve the patient by being directed elsewhere. Many of the tasks cited in the McDonald and Dzwonczyk study[103] were highly related to the management of the patient, even though they did not involve direct visualization of or contact with the patient. The critical question, which task analysis by itself cannot answer, is this: When anesthetists gaze at the surgical field, how often are they gathering information, and how often are they just "watching the scenery"? Put more generally, what is the information content of the various observations being made and what is their relation to action tasks and to the goals of conducting a safe anesthetic regimen?
Intriguingly, Drui and colleagues[100] had asked physicians who were helping to code their films, "What information, if any, do you gain from the direct performance of this activity?" However, these investigators never described what information was available from each activity, although they seem to have assumed that turning the anesthesiologist's gaze away from the patient and surgical field was bad. Boquet and coworkers[101] not only studied the gaze of anesthetists (using a sophisticated eye-tracking system), but they also asked consultant anesthetists to grade the importance of different visual targets and manual tasks. "The patient" was assigned the maximal importance on the scale. However, "the surgical field," which occupied 25% of the anesthetist's time was apparently not listed by the consultants. Perhaps, in their minds, the surgical field was lumped together with the patient.
Another key finding of the study by Drui and associates[100] was that 40% of the anesthetist's time was coded as "idle," meaning that no obvious task was seen on that frame of film. In 1988, McDonald and Dzwonczyk[103] stated that this and other "studies showed that the anaesthetist spends most time performing tasks that are either secondary or unrelated to patient care." However, in their original article, Drui and associates[100] correctly recognized that the absence of visually apparent activity did not mean that the anesthetist was truly idle; in fact, they hypothesized that this time was used by anesthetists to make the decisions on which the observable tasks were based.
The most detailed task analyses have taken place in a series of studies[81] [105] [106] [107] [108] [109] [110] [207] [208] [210] carried out by the UCSD/VA-Stanford group. These analyses have used progressively more task categories (11 to 28 to 32) to analyze the activities of novice and experienced anesthetists in day surgery cases and of senior residents during cardiac surgery. The studies have shown that a small number of tasks, repeated frequently, occupy the majority of case time. In one study, four tasks (observing monitors, recording, conversing with attending staff (for novice residents),
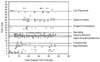 Figure 83-4
Distribution of the anesthetist's tasks during an actual
ambulatory surgery procedure. The anesthetist was directly observed by an investigator
who recorded a code number for each task as it was performed (there were 28 task
codes). Certain tasks, such as bag ventilation, were clustered in specific phases
of the case, whereas others, such as observing monitors, were repeated frequently
throughout the case.
Figure 83-4
Distribution of the anesthetist's tasks during an actual
ambulatory surgery procedure. The anesthetist was directly observed by an investigator
who recorded a code number for each task as it was performed (there were 28 task
codes). Certain tasks, such as bag ventilation, were clustered in specific phases
of the case, whereas others, such as observing monitors, were repeated frequently
throughout the case.
Studies by this group have attempted to determine whether there is a difference between the task patterns of novice versus experienced anesthetists. Confirming a priori expectations, the investigators found that novices perform many of the same tasks as do experienced personnel at specific phases of an anesthetic regimen; however, the novices had a longer dwell time, on average, for each task. These studies also showed that experienced providers had a lower heterogeneity of tasks and greater efficiency of tasks per unit of time.[109]
Of note (but also not unexpected), novice residents spent more time speaking to their attending staff (11% of preintubation time) than did experienced residents or certified registered nurse anesthetists (CRNAs). Of interest,
 Figure 83-5
FIT-System. The system allows easy reorganization of
task analysis items categories and can properly resolve overlapping actions. OR,
operating room
Figure 83-5
FIT-System. The system allows easy reorganization of
task analysis items categories and can properly resolve overlapping actions. OR,
operating room
An interdisciplinary research group consisting of the Work and Organisational Psychology Department of the Swiss Federal Institute of Technology (ETH) in Zurich
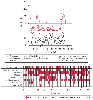 Figure 83-6
Action density diagram, illustrating the derived parameter
"action density" from anesthetic induction to emergence in a real anesthetic case:
The top line in the graph shows the overall action density and the dots show the
moving average of the density. The bottom line shows the contribution of one task
group "monitoring" as an example. The table in the lower graph shows the composition
of the data for all eight task groups from the same case.
Figure 83-6
Action density diagram, illustrating the derived parameter
"action density" from anesthetic induction to emergence in a real anesthetic case:
The top line in the graph shows the overall action density and the dots show the
moving average of the density. The bottom line shows the contribution of one task
group "monitoring" as an example. The table in the lower graph shows the composition
of the data for all eight task groups from the same case.
| Task group | Actions |
|---|---|
| Monitoring | Read patient record — observe patient — observe patient monitors — observe anesthesia machine — observe intravenous drip — observe syringe pumps — measurement — scan area |
| Measures | Placing IV — give drugs — adjust IV — mask ventilation — intubation/extubation — adjust anesthesia machine — use of other equipment — quitting alarms — suctioning |
| Communication | (1) Active conversation with: nurse anesthetist — attending anesthetist — surgeon — OR nurse — patient — others; (2) responsive conversation with: nurse anesthetist — attending anesthetist — surgeon — OR nurse — patient — others; and (3) response to pager |
| Documentation | Patient chart — labeling (drugs, drips, lab results) |
| Additional operations | Positioning of patient — patient transfer — tasks of others (circulating nurse, orderly) — arrange workplace — conversation with observer ("just looking") — miscellaneous — leaving OR (with possible audiovisual contact to OR) |
| OR, operating room. | |
Figure 83-6 and Figure 83-7 show examples of observations of 24 real OR studies. The observation data contain many short-term fluctuations (dots); the moving average
 Figure 83-7
Action density during separation from cardiopulmonary
bypass (CPB) without and with complications. The graph on the left
is the density diagram of an uncomplicated case (Case B) with a "flat" action density
diagram during (between the two vertical lines) and after separation from CPB. In
contrast, Case C, shown in the graph on the right,
had a complicated weaning from CPB: A very high action density is followed by an
elevated density with further peaks after separation.
Figure 83-7
Action density during separation from cardiopulmonary
bypass (CPB) without and with complications. The graph on the left
is the density diagram of an uncomplicated case (Case B) with a "flat" action density
diagram during (between the two vertical lines) and after separation from CPB. In
contrast, Case C, shown in the graph on the right,
had a complicated weaning from CPB: A very high action density is followed by an
elevated density with further peaks after separation.
Early task analyses identified repetitive tasks that did not appear to offer substantial information content or therapeutic benefit as candidates for automation. Drui and associates[100] identified filling out anesthesia records, measuring the blood pressure, and adjusting intravenous infusions. Kennedy et al[102] identified data display and trend plotting. Many of these tasks have, in fact, been automated in the past 20 years. Loeb,[230] from UCD, showed that anesthesiologists typically observed monitors for about 1 to 2 seconds every 10 to 20 seconds, and it usually took several observing cycles before they detected a subtle cue on the monitor. Gurushanthaiah and colleagues[231] studied the effect of more sophisticated display modalities on the signal detection of anesthesiologists and found that histogram and polygon formats improved response latency in the laboratory setting compared with formats using raw numbers only. However, the applicability of this laboratory finding to the more complex signal detection that must occur in the midst of patient care is uncertain. Incidentally, the experience in the field of aviation suggests that automation of both monitoring and therapeutic devices produces its own problems in human-machine interactions and may well be a causative or contributing factor in some adverse anesthetic events. Some of the same types of automation-related adverse events seen in aviation[143] [232] are now being observed in anesthesiology.[68] [144]
The impact of automation on task distribution is uncertain. The change to mechanical ventilation did affect the analyses of McDonald and Dzwonczyk, [103] as detailed earlier. A study by Dzwonczyk and coworkers[233] showed no reduction in time spent recording when automated record-keeping devices were used. However, the UCSD/VA-Stanford collaboration published data demonstrating a 20% reduction in the time spent record-keeping when automated record-keeping was in use during cardiac anesthesia.[108] [109] There was a slight, but not significant, increase in time spent on direct patient care activities when electronic record-keeping was in use. Thus, there is no clear evidence that electronic record-keeping will yield a marked enhancement of the anesthetist's ability to perform other patient care tasks, although automated record-keeping may yield other benefits. The UCD and UCSD/VA-Stanford groups demonstrated that electronic automated record-keeping does not significantly reduce the vigilance of anesthetists.[110] [234] [235]
|
|
|
|
|
|
|
|
|
|
|
|
|