|
|
|
|
|
|
|
|
|
|
|
|
|
|
|
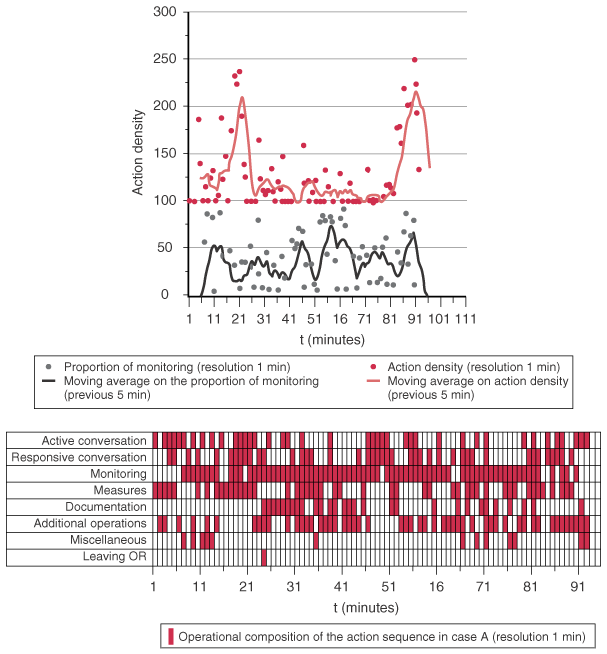
Figure 83-6
Action density diagram, illustrating the derived parameter
"action density" from anesthetic induction to emergence in a real anesthetic case:
The top line in the graph shows the overall action density and the dots show the
moving average of the density. The bottom line shows the contribution of one task
group "monitoring" as an example. The table in the lower graph shows the composition
of the data for all eight task groups from the same case.

|
|
|
|
|
|
|
|
|
|
|
|
|
|