|
|
|
|
|
|
|
|
|
|
|
|
|
|
|
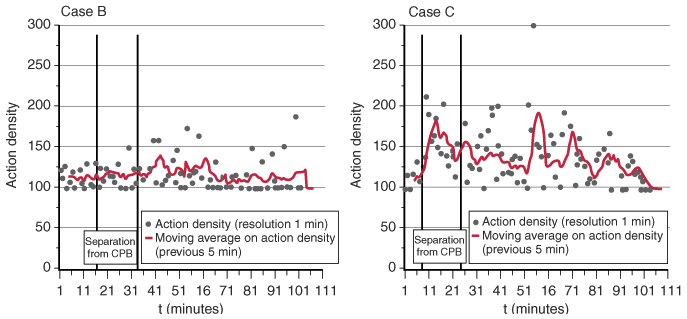
Figure 83-7
Action density during separation from cardiopulmonary
bypass (CPB) without and with complications. The graph on the left
is the density diagram of an uncomplicated case (Case B) with a "flat" action density
diagram during (between the two vertical lines) and after separation from CPB. In
contrast, Case C, shown in the graph on the right,
had a complicated weaning from CPB: A very high action density is followed by an
elevated density with further peaks after separation.

|
|
|
|
|
|
|
|
|
|
|
|
|
|