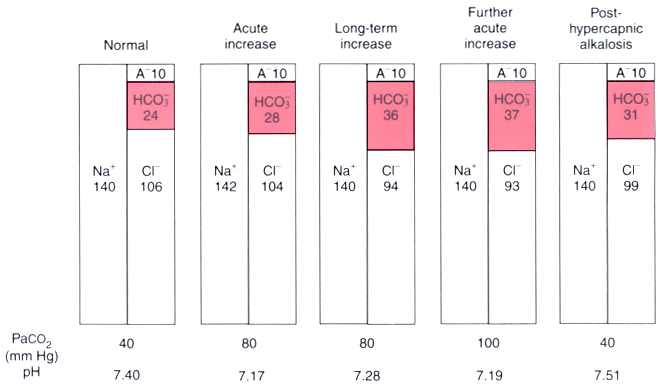
Figure 41-6
Changes in acid-based and electrolyte composition in
patients with respiratory acidosis. Left to right,
the panels depict normal acid-base status; adaptation to an acute rise in the partial
pressure of arterial carbon dioxide (PaCO2
)
to 80 mm Hg; adaptation to a long-term rise in PaCO2
to 80 mm Hg; superimposition of an acute further increment in PaCO2
(to a level of 100 mm Hg) in the same patient; and post-hypercapnic alkalosis resulting
from an abrupt reduction in PaCO2
to the
level of 40 mm Hg in the same patient. A-
denotes unmeasured plasma anions,
and the numbers within the bars give ion concentrations in millimoles per liter.
(Adapted from Androgue H, Madias N: Management of life-threatening acid-base
disorders. First of two parts. N Engl J Med 338:26–34, 1998.)

