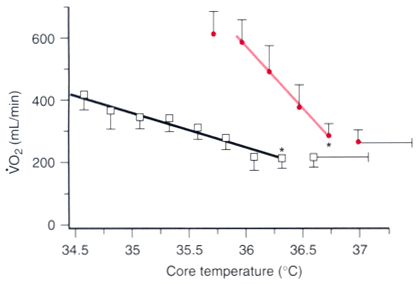
Figure 40-13
Systemic oxygen consumption without (circles)
and with (squares) epidural anesthesia. The horizontal
standard deviation bars indicate variability in the thresholds among the volunteers;
although errors bars are shown only once in each series, the same temperature variability
applies to each data point. The slopes of the oxygen consumption-versus-core temperature
relationships (solid lines) were determined by linear
regression. These slopes defined the gain of shivering with and without epidural
anesthesia. Gain was reduced 3.7-fold, from -412 mL/min/°C (r2
= .99) to -112 mL/min/°C (r2
=
.96). (Redrawn from Kim J-S, Ikeda T, Sessler D, et al: Epidural
anesthesia reduces the gain and maximum intensity of shivering. Anesthesiology 88:851–857,
1998.)

