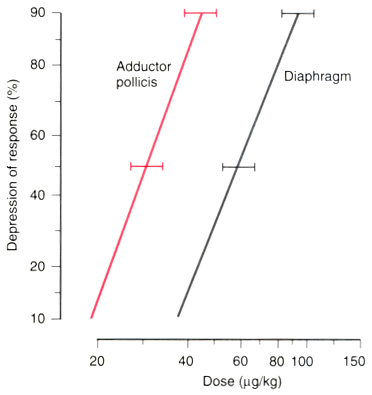
Figure 39-10
Mean cumulative dose-response curve for pancuronium in
two muscles shows that the diaphragm requires approximately twice as much pancuronium
as does the adductor pollicis muscle for the same amount of neuromuscular blockade.
The depression in muscle response to the first stimulus in TOF nerve stimulation
(probit scale) was plotted against dose (log scale). Force of contraction of the
adductor pollicis was measured on a force-displacement transducer; response of the
diaphragm was measured electromyographically. (From Donati F, Antzaka C,
Bevan DR: Potency of pancuronium at the diaphragm and the adductor pollicis muscle
in humans. Anesthesiology 65:1, 1986.)

