|
|
|
|
|
|
|
|
|
|
|
|
|
|
|
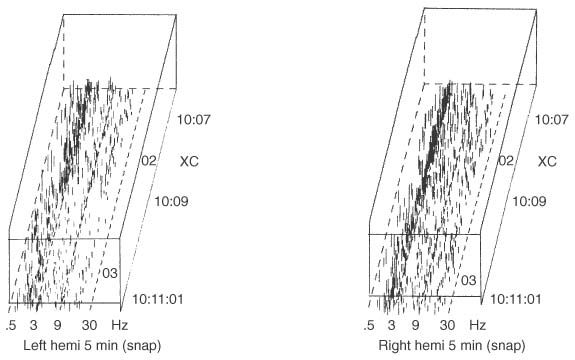
Figure 38-7
This Lifescan printout was obtained approximately 3 minutes
after occlusion (XC) of the left carotid artery. It shows attenuation of activity
on the left with occlusion. The electroencephalogram showed a similar change. The
regional cerebral blood flow with occlusion was 9 mL/100 g/min. (From Spackman
TN, Faust RJ, Cucchiara RF, et al: A comparison of a periodic analysis of the EEG
with standard EEG and cerebral blood flow for detection of ischemia. Anesthesiology
66:229, 1987.)
|
|
|
|
|
|
|
|
|
|
|
|
|
|