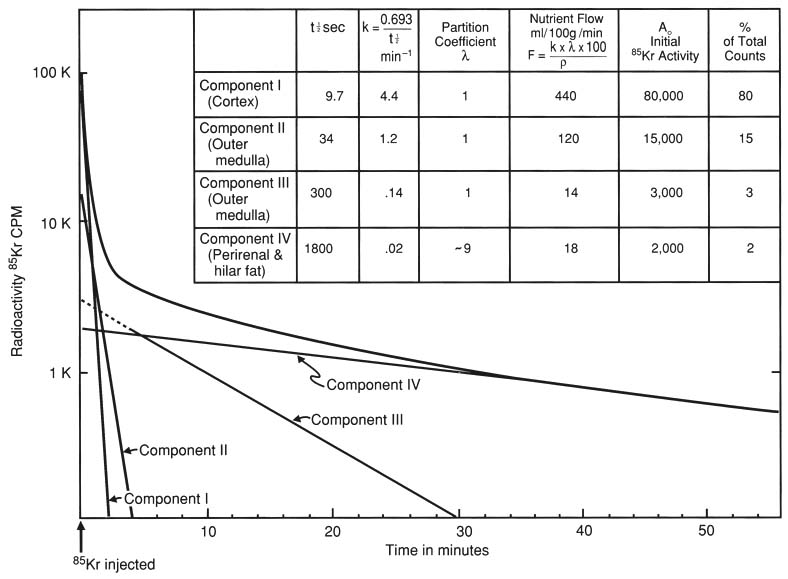
Figure 37-10
Analysis of an externally monitored radioactive krypton
washout curve for the kidney in a dog. Notice the logarithmic vertical scale. The
rapid component (I) represents cortical blood flow. Half-times for each component
together with estimated flow rates and compartment sizes are shown in the table above
the plotted curves. (From Thorburn GD, Kopald HH, Herd A, et al: Intrarenal
distribution of nutrient blood flow determined by krypton 85 in the unanesthetized
dog. Circ Res 13:290, 1963.)