|
|
|
|
|
|
|
|
|
|
|
|
|
|
|
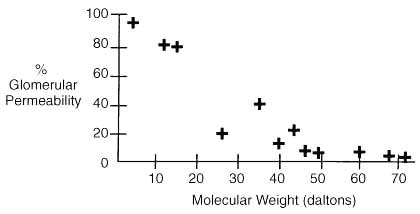
Figure 37-1
The glomerular permeability (i.e., filtration-to-plasma
ratio) is represented on the y axis and compared
with the molecular weight of the filtered substance represented on the x
axis. (Data from Renkin EM, Robinson RR: Glomerular filtration. N Engl
J Med 290:785, 1974.)
|
|
|
|
|
|
|
|
|
|
|
|
|
|