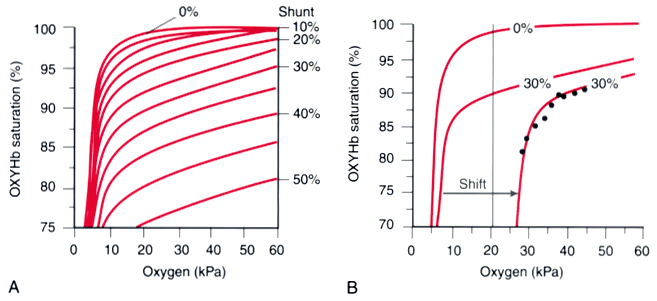
Figure 36-7
Hemoglobin-oxygen (OXYHb) saturation versus inspired
partial pressure of oxygen (PO2
). The
curves are plotted by changing inspired PO2
in a stepwise fashion. A, A series of theoretical
curves obtained by calculating the effect of different degrees of right-to-left shunt.
Increasing shunt displaces the curves downward. B,
The curve on the left of the graph (0%) is from a normal subject. The middle curve
(30%) represented a 30% right-to-left shunt from the 30% curve seen in A.
The curve on the right of this graph is from a patient undergoing thoracotomy for
esophageal surgery. The points cannot be fitted by any of the shunt curve, but the
fit is quite good when the 30% curve is shifted to the right. This implies a combination
of shunt and V̇A/ mismatch. (Adapted
from Jones JG, Jones SE: Discriminating between the effect of shunt and reduced
VA/Q on arterial oxygen saturation is particularly
useful in clinical practice. J Clin Monit Comput 16:337, 2000.)

![]() mismatch. (Adapted
from Jones JG, Jones SE: Discriminating between the effect of shunt and reduced
VA/Q on arterial oxygen saturation is particularly
useful in clinical practice. J Clin Monit Comput 16:337, 2000.)
mismatch. (Adapted
from Jones JG, Jones SE: Discriminating between the effect of shunt and reduced
VA/Q on arterial oxygen saturation is particularly
useful in clinical practice. J Clin Monit Comput 16:337, 2000.)