 |
|
|
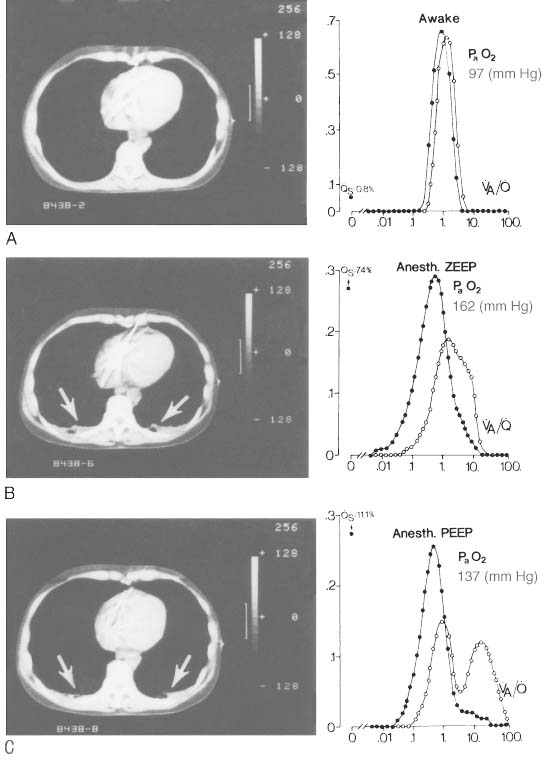
Figure 36-6
Effect of anesthesia on pulmonary atelectasis and gas
exchange. A, Computed tomography of the chest of
an awake patient. Adjacent to the scan is the distribution of ventilation (open
circles) and perfusion (solid circles)
in a 50-compartment lung model, determined by using the multiple inert gas method.
A unimodal distribution is shown for the awake individual with a shunt fraction
( S/T)
of 0.8%. B, After a period of general anesthesia
with positive-pressure ventilation, crescent-shaped areas of increased tissue density
(arrows) appear in posterior lung regions. Corresponding
to these changes are a widening of both V̇A and
distributions and an increase in S/T
to 7.4%. C, The scan and data are shown for the same
individual after application of 10 cm H2
O of PEEP. Very little change
is observed in the areas of atelectasis, and V̇A/
matching is further worsened, with the development of a bimodal ventilation distribution
and a further increase in S/T
to 11.1%. These changes are accompanied by a drop in PaO2
from 162 to 137 mm Hg. (Adapted from Tokics L, Hedenstierna G, Strandberg
A, et al: Lung collapse and gas exchange during general anesthesia: Effects of
spontaneous breathing, muscle paralysis and positive end-expiratory pressure. Anesthesiology
66:157, 1987.)
S/T)
of 0.8%. B, After a period of general anesthesia
with positive-pressure ventilation, crescent-shaped areas of increased tissue density
(arrows) appear in posterior lung regions. Corresponding
to these changes are a widening of both V̇A and
distributions and an increase in S/T
to 7.4%. C, The scan and data are shown for the same
individual after application of 10 cm H2
O of PEEP. Very little change
is observed in the areas of atelectasis, and V̇A/
matching is further worsened, with the development of a bimodal ventilation distribution
and a further increase in S/T
to 11.1%. These changes are accompanied by a drop in PaO2
from 162 to 137 mm Hg. (Adapted from Tokics L, Hedenstierna G, Strandberg
A, et al: Lung collapse and gas exchange during general anesthesia: Effects of
spontaneous breathing, muscle paralysis and positive end-expiratory pressure. Anesthesiology
66:157, 1987.)
|
|