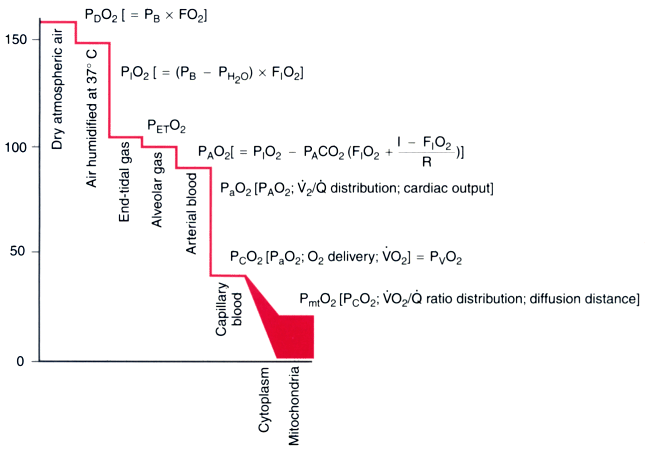
Figure 36-1
Oxygen transport cascade. A schematic view of the steps
in oxygen transport from the atmosphere to the site of utilization in the mitochondrion
is shown here. Approximate PO2
values
are shown for each step in the cascade, and factors determining those partial pressures
are shown within the square brackets. There is a distribution of tissue PO2
values depending on local capillary blood flow, tissue oxygen consumption, and diffusion
distances. Mitochondrial PO2
values are
depicted as a range because reported levels vary widely. (Adapted from Nunn
JF: Nunn's Applied Respiratory Physiology, 4th ed. Boston, Butterworth-Heinemann,
1993.)

