 |
|
|
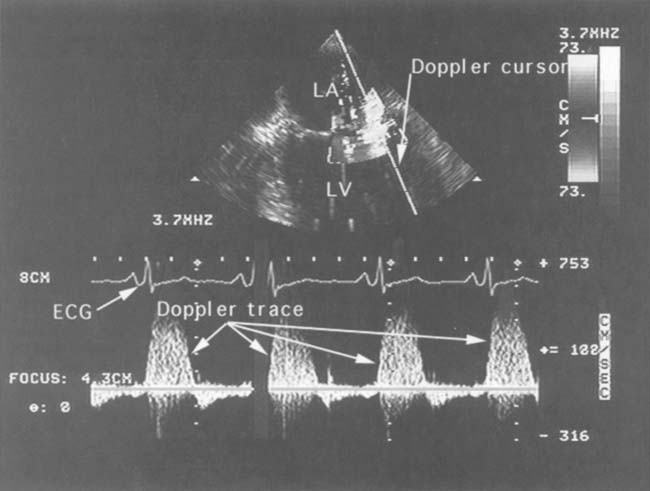
Figure 33-5
Continuous-wave Doppler measures high-velocity flow without
aliasing. Continuous-wave Doppler measurement of blood flow velocities in a mitral
valve orifice during four cardiac cycles is shown. At the top of the figure is a
still-frame image of the two-dimensional cross section used to position the Doppler
sample cursor (the diagonal white line). On the
bottom two thirds of the figure is the display in white of all the instantaneous
blood flow velocities (vertical axis) versus time (horizontal axis) occurring anywhere
along that cursor. The electrocardiogram provides timing, and the bold
horizontal line is the baseline (zero flow) for the flow velocities.
Flow velocities above this line are positive (i.e., toward the transducer) to a maximum
of 753 cm/sec. Flow velocities below this line are negative (i.e., away from the
transducer) to a maximum of -316 cm/sec. This tracing documents significant mitral
regurgitation (the positive systolic velocities) with a peak blood flow velocity
of approximately 5 m/sec (each white dot on the vertical
axis equals 100 cm/sec or 1 m/sec). LA, left atrium; LV, left ventricle. (From
Cahalan MK: Intraoperative Transesophageal Echocardiography. An Interactive Text
and Atlas. New York, Churchill Livingstone, 1997.)
|
|