 |
|
|
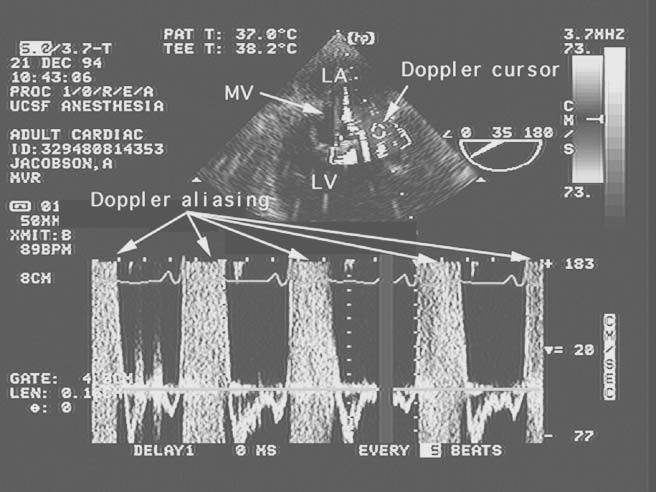
Figure 33-4
Pulsed-wave Doppler with aliasing at high velocities.
Pulsed-wave Doppler measurement of blood flow velocities in a mitral valve (MV)
orifice during four cardiac cycles is shown. At the top of the figure is a still-frame
image of the two-dimensional cross section used to position the Doppler sample volume
(the round white sphere). On the bottom two thirds
of the figure is the display in white of the instantaneous blood flow velocities
(vertical axis) versus time (horizontal axis) occurring in that sample volume. The
electrocardiogram provides timing, and the bold horizontal line
is the baseline (zero flow) for the flow velocities. Flow velocities above this
line are positive (i.e., toward the transducer) to a maximum of 183 cm/sec. Flow
velocities below this line are negative (i.e., away from the transducer) to a maximum
of -77 cm/sec. This tracing documents significant mitral regurgitation (the positive
systolic velocities) but does not measure the peak velocity of regurgitant flow because
it is beyond the Nyquist limit—the systolic velocities off the top of the scale
are said to alias, that is, they go off scale and wrap around into the domain of
negative velocities. LA, left atrium; LV, left ventricle. (From Cahalan
MK: Intraoperative Transesophageal Echocardiography. An Interactive Text and Atlas.
New York, Churchill Livingstone, 1997.)
|
|