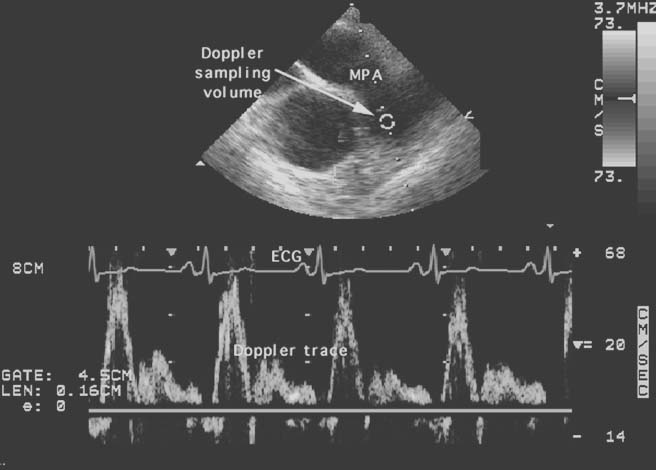
Figure 33-3
Pulsed-wave Doppler echocardiogram of the main pulmonary
artery (MPA). At the top of the echocardiogram is a still-frame image of the two-dimensional
cross section used to position the Doppler sample volume (the round
white sphere). On the bottom two thirds of the echocardiogram is the
display in white of the instantaneous blood flow velocities (vertical axis) versus
time (horizontal axis) occurring in that sample volume. The electrocardiogram provides
timing, and the bold horizontal line is the baseline
(zero flow) for the flow velocities. Flow velocities above this line are positive
(i.e., toward the transducer) to a maximum of 68 cm/sec. Flow below this line is
negative (i.e., away from the transducer) to a maximum of -14 cm/sec. (From
Cahalan MK: Intraoperative Transesophageal Echocardiography. An Interactive Text
and Atlas. New York, Churchill Livingstone, 1997.)