 |
|
|
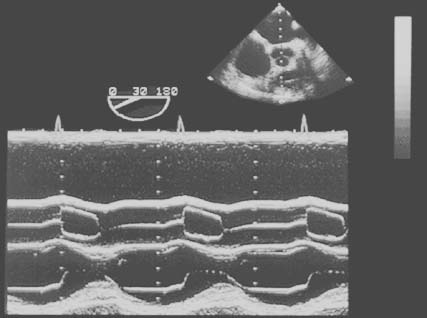
Figure 33-1
M-mode transesophageal echocardiogram of a normal aortic
valve. For reference, a single frame (stop action) of the two-dimensional cross
section is shown at the top right of the figure. The dotted
vertical line through the two-dimensional echocardiogram depicts the single
line of sampling provided by the M-mode echocardiogram over time (the horizontal
axis for the lower two thirds of the figure). The electrocardiogram defines systole
and diastole. Note in the middle of the M-mode image the three tilted
rectangles connected by the slightly undulating line.
These rectangles and lines are formed by the motion of the leaflets of the aortic
valve as they open and close during the cardiac cycles shown. From top to bottom
in this M-mode echocardiogram, the structures indicated by the white
lines are the posterior wall of the left atrium (just under the electrocardiogram),
the posterior wall of the aortic annulus, the aortic valve (as described above),
the anterior wall of the aortic annulus, a pulmonary artery catheter, and the myocardium
of the right ventricular outflow tract. (From Cahalan MK: Intraoperative
Transesophageal Echocardiography. An Interactive Text and Atlas. New York, Churchill
Livingstone, 1997.)
|
|