|
|
|
|
|
|
|
|
|
|
|
|
|
|
|
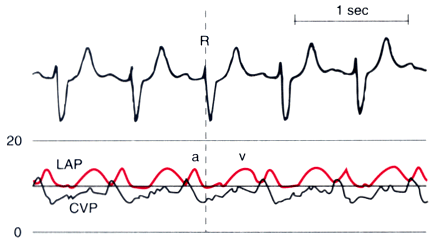
Figure 32-35
Normal temporal relationships between the electrocardiographic,
central venous pressure (CVP), and left atrial pressure (LAP) traces. The LAP and
CVP waveforms have nearly identical morphologies, although the CVP a wave slightly
precedes the LAP a wave. (Redrawn from Mark JB: Atlas of Cardiovascular
Monitoring. New York, Churchill Livingstone, 1998, Fig. 2-9.)
|
|
|
|
|
|
|
|
|
|
|
|
|
|