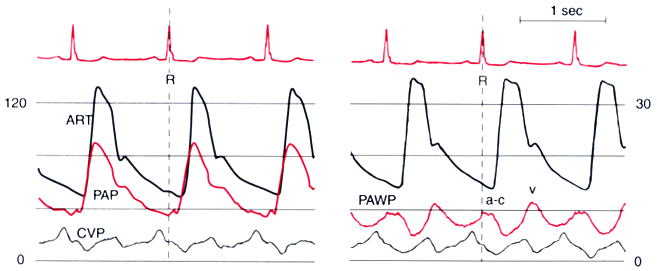
Figure 32-32
Temporal relationships between normal systemic arterial
pressure (ART), pulmonary artery pressure (PAP), central venous pressure (CVP), and
pulmonary artery wedge pressure (PAWP). Note that the PAWP a-c and v waves appear
to occur later in the cardiac cycle than do their counterparts on the right side
of the heart seen in the CVP trace. The ART scale is on the left,
and the PAP, CVP, and PAWP scales are on the right. (Redrawn from Mark JB:
Atlas of Cardiovascular Monitoring. New York, Churchill Livinstone, 1998, Fig.
3-3.)

