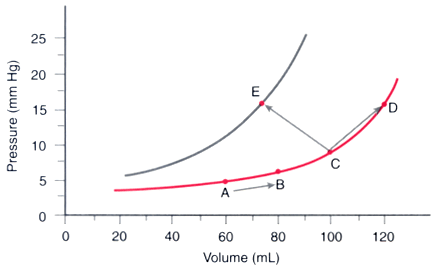
Figure 32-23
Ventricular diastolic pressure-volume relationship.
Along the flat portion of the curve, a 20-mL increase in ventricular volume causes
a small increase in ventricular pressure (A to B). In contrast, the same increase
in volume along the steep portion of the ventricular filling curve causes a marked
increase in filling pressure (C to D). Another problem associated with the use of
filling pressure as a surrogate for filling volume arises when shifts in the pressure-volume
relationship occur. At point C, ventricular volume is 100 mL and ventricular pressure
is 8 mm Hg. An increase in filling pressure to 15 mm Hg may accompany either increased
volume (D) or decreased volume (E). The latter occurs when ventricular compliance
changes and shifts the ventricular diastolic pressure-volume relationship up and
to the left. (Redrawn from Mark JB: Atlas of Cardiovascular Monitoring.
New York, Churchill Livingstone, 1998, Fig. 15-2.)

