 |
 |
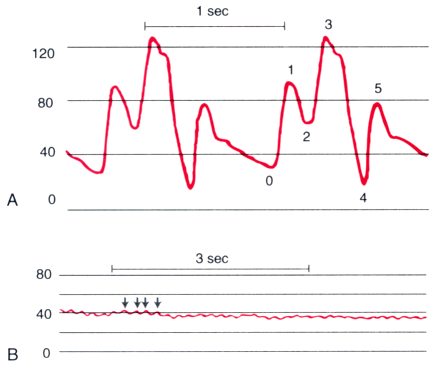
Figure 32-20
Unusual arterial pressure waveforms. A,
Intra-aortic balloon counterpulsation with a 1:2 balloon-assist ratio produces a
characteristic change in the arterial pressure waveform. Four cardiac cycles are
shown, two with balloon assistance and two without. 0, Unassisted end-diastolic
pressure; 1, unassisted systolic pressure; 2, dicrotic notch; 3, assisted or augmented
diastolic pressure; 4, end-diastolic or presystolic dip; 5, assisted systolic pressure.
Effective afterload reduction by the intra-aortic balloon is demonstrated by the
presystolic dip pressure (4) lower than the unassisted end-diastolic pressure (0)
and the assisted systolic pressure peak (5) lower than the unassisted systolic pressure
peak (1). B, Arterial pressure waveform during cardiopulmonary
bypass. Small phasic pressure variations (arrows)
result from the mechanical action of the bypass roller pump. The bypass pump flow
rate may be estimated by measuring these pulsations. Nineteen pulsations are recorded
in a 3-second time interval. In this case, the pump configured with ⅜-inch
tubing has an effective stroke volume of 27 mL. The pump flow rate may be calculated
as follows: (19 pulsations/3 seconds) × (1 pump revolution/2 pulsations)
× (27 mL/revolution) × (60 sec/min) = 5130 mL/min.
This calculated pump flow rate should equal the flow rate displayed on the pump
console (i.e., 5.2 L/min). (Redrawn from Mark JB: Atlas of Cardiovascular
Monitoring. New York, Churchill Livingstone, 1998, Figs. 20-3 and 19-8.)

 |
