 |
 |
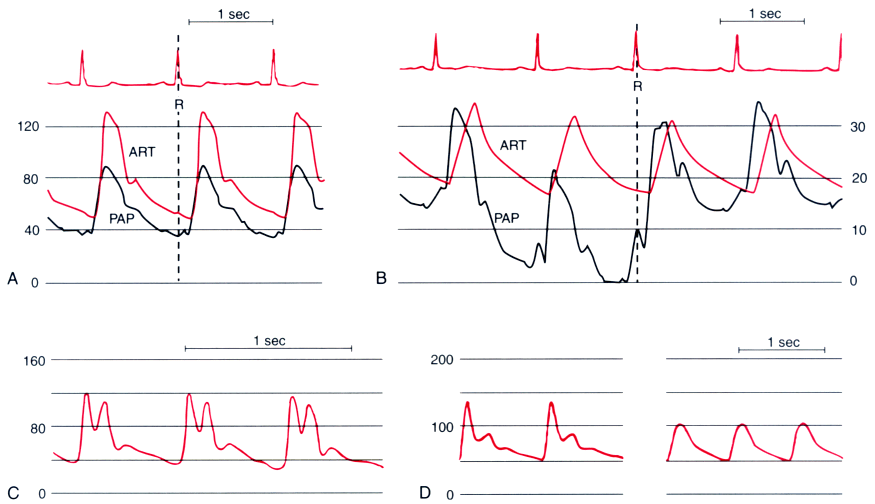
Figure 32-18
Influence of pathologic conditions on arterial pressure
(ART) waveform morphology. A, Normal ART and pulmonary
artery pressure (PAP) waveform morphologies demonstrating the similar timing of these
waveforms relative to the electrocardiographic R wave. B,
In aortic stenosis, the ART waveform is distorted and has a slurred upstroke and
delayed systolic peak. These changes are particularly striking in comparison to
the normal PAP waveform. Note the beat-to-beat respiratory variation in the PAP
waveform. See the text for greater detail. For A
and B, the ART scale is on the left
and the PAP scale is on the right. C,
Aortic regurgitation produces a regurgitation produces a bisferiens pulse and a wide
pulse pressure. See the text for greater detail. D,
An arterial pressure waveform in a patient with hypertrophic cardiomyopathy shows
a peculiar "spike-and-dome" configuration. The pressure waveform assumes a more
normal morphology after surgical correction of this condition. (Redrawn
from Mark JB: Atlas of Cardiovascular Monitoring. New York, Churchill Livingstone,
1998, Figs. 3-3, 17-21, and 17-24.)

 |
