|
|
|
|
|
|
|
|
|
|
|
|
|
|
|
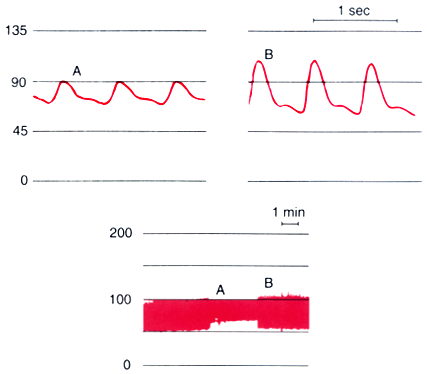
Figure 32-7
Overdamped arterial pressure waveform. The overdamped
pressure waveform (A) shows a diminished pulse pressure
when compared with the normal waveform (B). The
slow-speed recording below demonstrates a 3-minute period of damped arterial pressure.
Despite the damped pressure waveform, mean arterial pressure remains unchanged during
this period. (Redrawn from Mark JB: Atlas of Cardiovascular Monitoring.
New York, Churchill Livingstone, 1998, Fig. 9-3.)
|
|
|
|
|
|
|
|
|
|
|
|
|
|