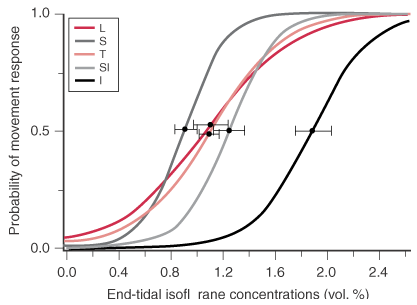
Figure 31-11
Logistic regression analysis of the end-tidal isoflurane
concentration relative to the predicted probability of no movement response for different
noxious stimuli. Bars indicate the 95% confidence
bounds to the end-tidal concentration with a 50% probability of response. I, laryngoscopy/intubation;
L, laryngoscopy; S, trapezius muscle squeeze; SI, skin incision; T, tetanic nerve
stimulation. (Redrawn with modification from Zbinden AM, Maggiorini M, Petersen-Felix
S, et al: Anesthetic depth defined using multiple noxious stimuli during isoflurane/oxygen
anesthesia. I. Motor reactions. Anesthesiology 80:253, 1994.)

