|
|
|
|
|
|
|
|
|
|
|
|
|
|
|
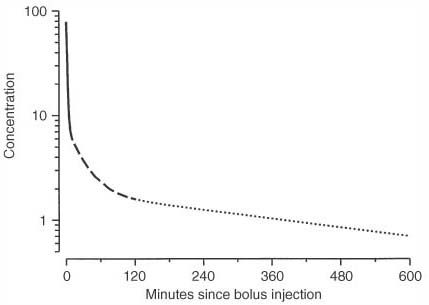
Figure 3-18
Concentration versus time relationship shows a very rapid
initial decline after bolus injection. The terminal log-linear portion is seen only
after most of the drug has left the plasma. This is characteristic of most anesthetic
drugs. Different line types highlight the rapid, intermediate, and slow (log-linear)
portions of the curve.

|
|
|
|
|
|
|
|
|
|
|
|
|
|