 |
 |
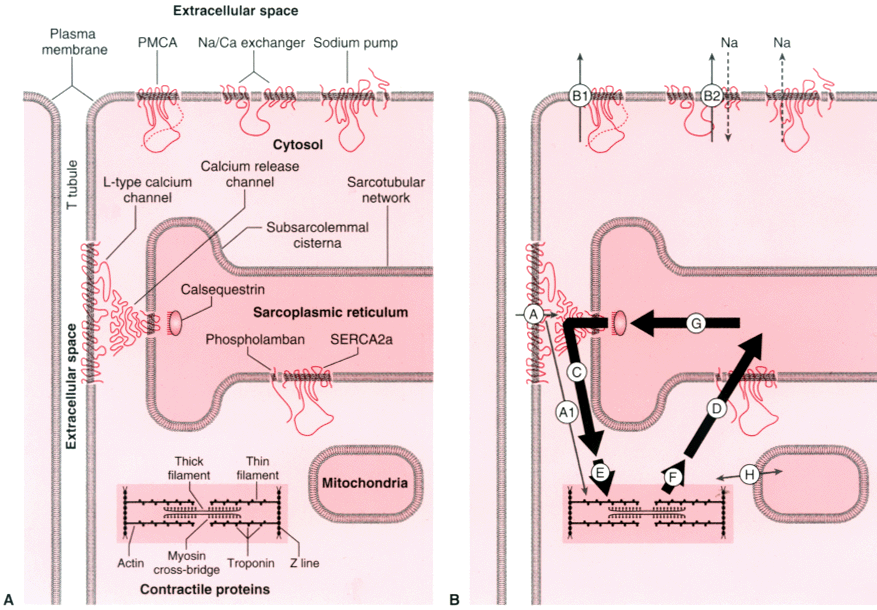
Figure 18-12
A, Diagram depicting the
components of cardiac excitation-contraction coupling. Calcium pools are noted in
bold letters. B, Extracellular (arrows
A, B1, B2) and intracellular calcium flux (arrows,
C, D, E, F, G) is shown. The thickness of the arrows
indicates the magnitude of the calcium flux, the vertical orientations describe their
energetics: downward-pointing arrows represent passive
calcium flux, and upward pointing arrows represent
energy-dependent calcium transport. Calcium entering the cell from extracellular
fluid through L-type calcium channels triggers calcium release from the sarcoplasmic
reticulum (SR). Only a small portion directly activates the contractile proteins
(A1). Arrow B1 depicts active transport of calcium
into the extracellular fluid by means of the plasma membrane pump ATPase and the
Na+
-Ca2+
exchanger. Sodium that enters the cell in exchange
for calcium (dashed line) is pumped out of the cytosol
by the sodium pump. SR regulates calcium efflux from the subsarcolemmal cisternae
(arrow C) and calcium uptake into the sarcotubular
network (arrow D). Arrow G
represents calcium that diffuses within the SR. Calcium binding to (arrow
E) and dissociation from (arrow F) high-affinity
calcium binding sites of troponin C activate and inhibit interactions of the contractile
proteins. Arrow H depicts calcium movement into
and out of mitochondria to buffer the cytosolic calcium concentration. (From
Katz AM: Calcium fluxes. In Physiology of the Heart,
3rd ed. Philadelphia, Lippincott-Raven, 2001, pp 232–233.)

 |
