|
|
|
|
|
|
|
|
|
|
|
|
|
|
|
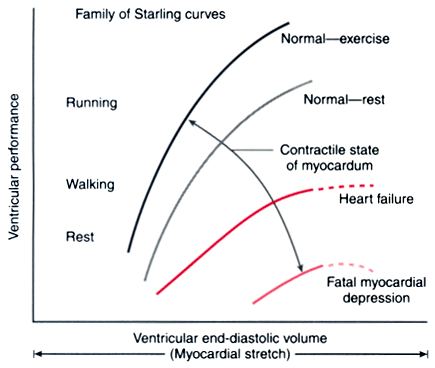
Figure 18-5
A family of Starling curves is shown. A leftward shift
of the curve denotes enhancement of the inotropic state, whereas a rightward shift
denotes decreased inotropy. (From Opie LH: Ventricular function. In
The Heart. Physiology from Cell to Circulation, 3rd ed. Philadelphia, Lippincott-Raven,
1998, pp 343–389.)

|
|
|
|
|
|
|
|
|
|
|
|
|
|