|
|
|
|
|
|
|
|
|
|
|
|
|
|
|
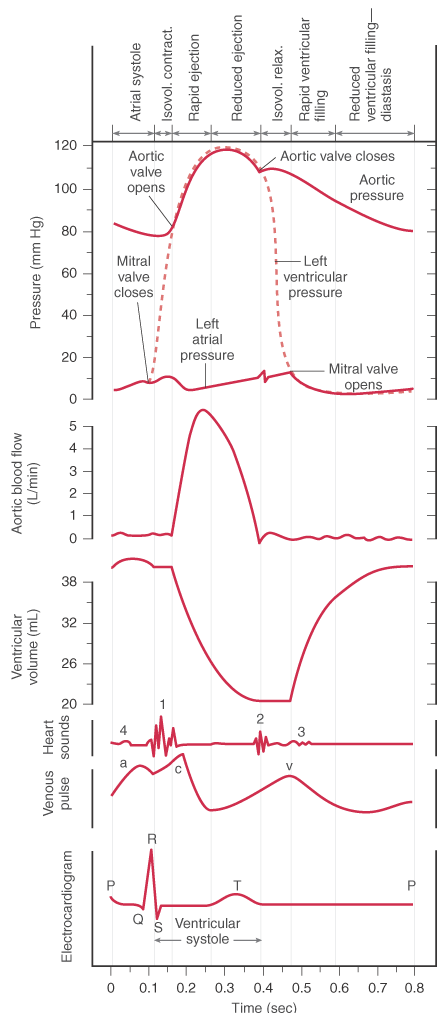
Figure 18-1
The electrical and mechanical events during a single
cardiac cycle are depicted. Shown are pressure curves of aortic blood flow, ventricular
volume, venous pulse, and the electrocardiogram. (From Berne RM, Levy MN:
The cardiac pump. In Cardiovascular Physiology,
8th ed. St Louis, Mosby, 2001, pp 55–82.)
|
|
|
|
|
|
|
|
|
|
|
|
|
|