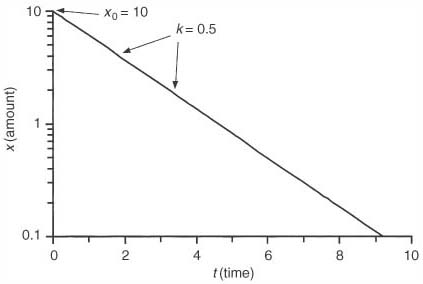
Figure 3-13 The same exponential decay curve, x(t) = x0 e−kt , as in Figure 3-12 is plotted on a log y axis.