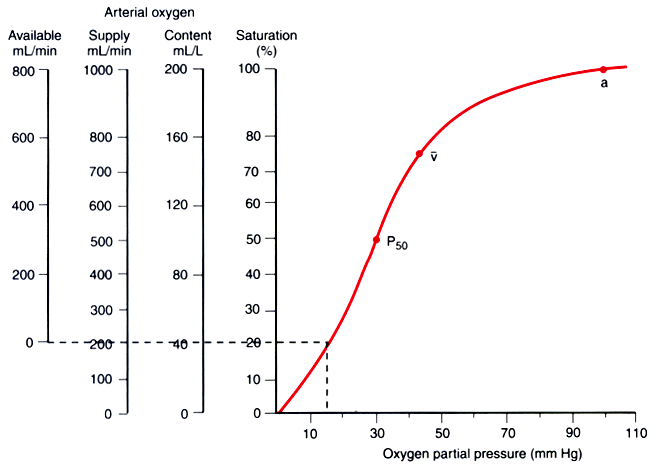
Figure 17-25
Oxygen-hemoglobin dissociation curve. Four different
ordinates are shown as a function of oxygen partial pressure (the abscissa). In
order from right to left, they are saturation (%); O2
content (mL of O2
/0.1
L of blood); O2
supply to peripheral tissues (mL/min); and O2
available to peripheral tissues (mL/min), which is O2
supply minus the
approximately 200 mL/min that cannot be extracted below a partial pressure of 20
mm Hg. Three points are shown on the curve: a, normal arterial pressure;  ,
normal mixed venous pressure; and P50
, the partial pressure (27 mm Hg)
at which hemoglobin is 50% saturated.
,
normal mixed venous pressure; and P50
, the partial pressure (27 mm Hg)
at which hemoglobin is 50% saturated.

![]() ,
normal mixed venous pressure; and P50
, the partial pressure (27 mm Hg)
at which hemoglobin is 50% saturated.
,
normal mixed venous pressure; and P50
, the partial pressure (27 mm Hg)
at which hemoglobin is 50% saturated.