|
|
|
|
|
|
|
|
|
|
|
|
|
|
|
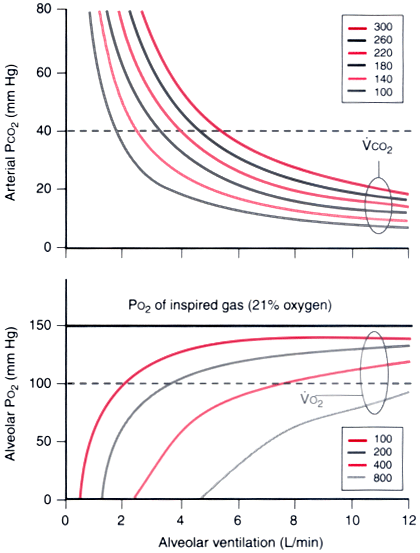
Figure 17-23
The relationship between alveolar ventilation and PAO2
and PaO2
for a group of different O2
consumption (V̇O2
) and CO2
production (V̇CO2
) values is derived
from Equations 10 and 11 in the text and is hyperbolic. As alveolar ventilation
increases, PAO2
and PaCO2
approach inspired concentrations. Decreases in alveolar ventilation to less than
4 L/min are accompanied by precipitous decreases in PAO2
and increases in PaCO2
.

|
|
|
|
|
|
|
|
|
|
|
|
|
|