|
|
|
|
|
|
|
|
|
|
|
|
|
|
|
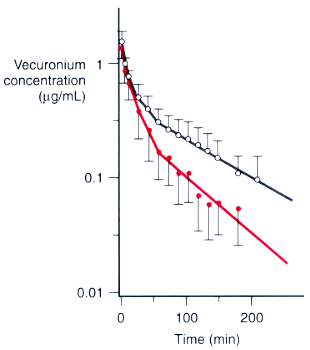
Figure 13-15
Disappearance of vecuronium from plasma after a single
bolus dose of 0.2 mg/kg, as illustrated by a semilogarithmic plot of the mean concentration
versus time for patients with normal hepatic function (filled
circles) and cirrhotic patients (open circles).
Error bars are the SD for that value. (Redrawn from Lebrault C, Berger
JL, D'Hollander AA, et al: Pharmacokinetics and pharmacodynamics of vecuronium [ORG
NC 45] in patients with cirrhosis. Anesthesiology 62:601–605, 1985.)

|
|
|
|
|
|
|
|
|
|
|
|
|
|