|
|
|
|
|
|
|
|
|
|
|
|
|
|
|
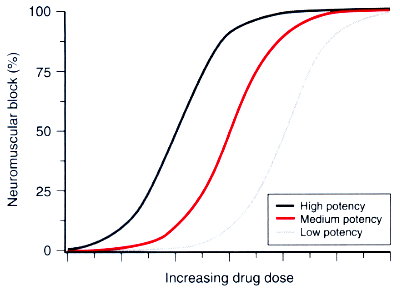
Figure 13-14
Schematic representation of a semilogarithmic plot of
muscle relaxant dose versus neuromuscular block. A drug of high potency would be
represented by doxacurium, one of medium potency by atracurium, and one of low potency
by rocuronium. The graph illustrates that the relative potencies of the muscle relaxants
span a range of approximately 2 orders of magnitude.

|
|
|
|
|
|
|
|
|
|
|
|
|
|