|
|
|
|
|
|
|
|
|
|
|
|
|
|
|
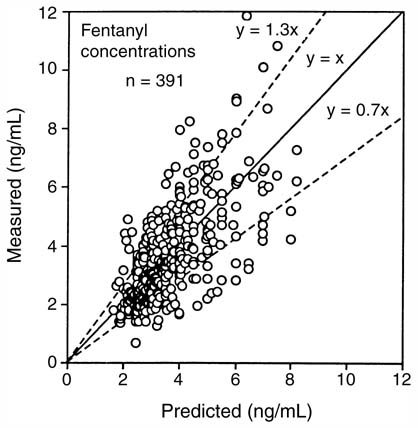
Figure 12-27
Plot of the measured to the predicted concentration of
fentanyl administered via CACI in 24 patients. The solid line
represents the line of identity; that is, the target concentration is equal to the
measured concentration. The dashed lines represent
a bias of ±30%.
|
|
|
|
|
|
|
|
|
|
|
|
|
|