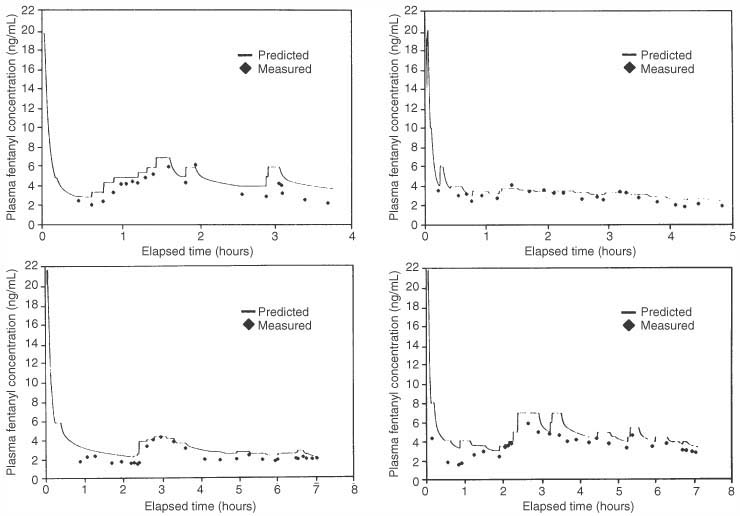
Figure 12-26 Individual plots of the target plasma fentanyl concentration (solid line) and measured concentration (dots) in four separate patients.