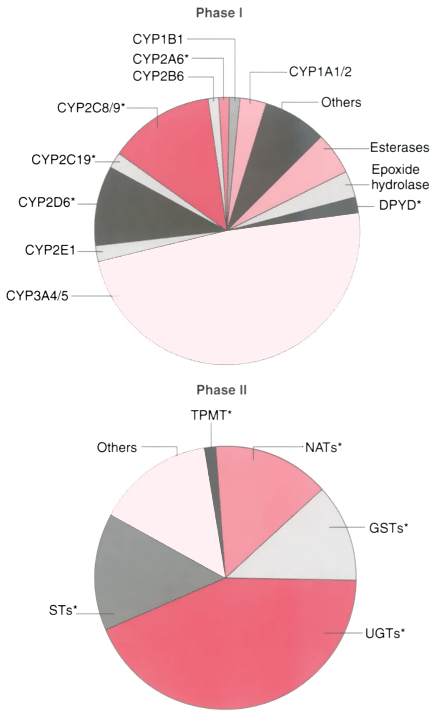
Figure 8-2
Proportion of drugs metabolized by major phase 1 or phase
2 enzymes. The relative size of each pie section indicates the estimated percentage
of phase 1 (left) or phase 2 (right)
metabolism that each enzyme contributes to the metabolism of drugs based on literature
reports. Enzymes that have functional allelic variants are indicated by an asterisk.
In many cases, more than one enzyme is involved in a particular drug's metabolism.
CYP, cytochrome P450; DPYD, dihydropyridine dehydrogenase; GST, glutathione S-transferase;
NAT, N-acetyltransferase; ST, sulfotransferase; TPMT,
thiopurine methyltransferase; UGT, UDP-glucuronosyltransferase. (Adapted
from Wilkinson G: Pharmacokinetics: The dynamics of drug absorption, distribution
and elimination. In Hardman JG, Limbird LE, Goodman
GA [eds]: Goodman and Gilman's the Pharmacological Basis of Therapeutics, 10th ed.
New York, McGraw-Hill, 2001.)

