|
|
|
|
|
|
|
|
|
|
|
|
|
|
|
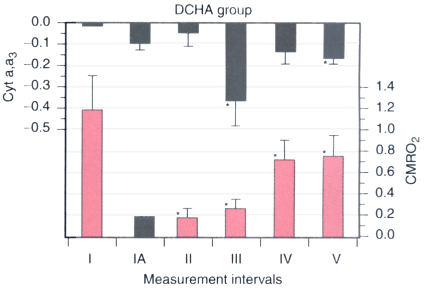
Figure 51-9
Bar graph of variations in cytochrome oxidase (cyt a,a3
)
near-infrared spectroscopic signals and cerebral metabolic rate for oxygen (CMRO2
)
in subjects with deep hypothermic circulatory arrest (DHCA). Each point of cyt a,a3
represents mean ± SE in six subjects; CMRO2
values are mean ±
SD. Negative values in cyt a,a3
represent relative decreases in quantity
of oxidized enzyme. *, CMRO2
and cyt a,a3
are significantly
different from control, p < .05.

|
|
|
|
|
|
|
|
|
|
|
|
|
|