|
|
|
|
|
|
|
|
|
|
|
|
|
|
|
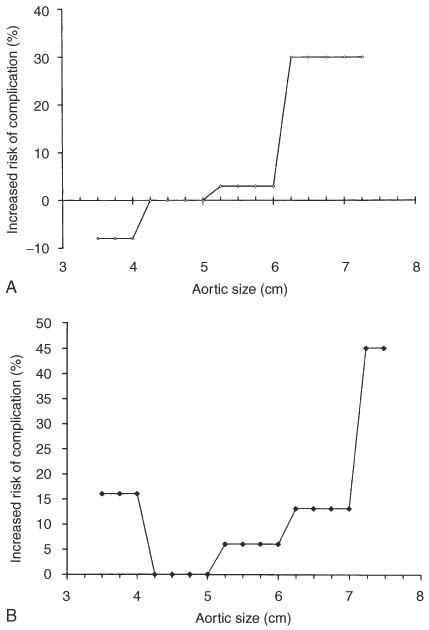
Figure 50-25
A, Influence of aortic
size on the cumulative lifetime incidence of natural complications of an aortic aneurysm.
On the y axis is plotted the incidence of natural
complications (rupture or dissection); on the x axis,
aortic size is plotted. This plot is for the ascending aorta. Note the hinge point
at 6 cm. B, The same plot for the descending aorta.
Note the hinge point at 7 cm.

|
|
|
|
|
|
|
|
|
|
|
|
|
|