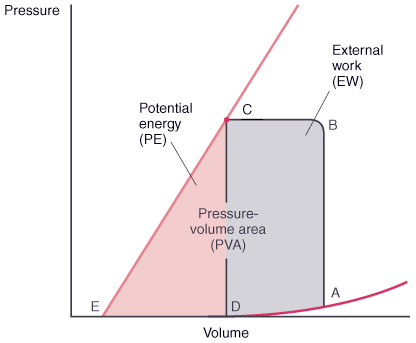
Figure 50-7
Myocardial oxygen consumption correlates with the left
ventricular pressure-volume area (PVA). PVA is in the area of the pressure-volume
(P-V) diagram that is circumscribed by the end-systolic P-V line (E-C), the end-diastolic
P-V relation cure (D-A), and the systolic segment of the P-V trajectory (E-C-D-E).
PVA consists of the external work (EW) performed during systole and the end-systolic
elastic potential energy (PE) stored in the ventricular wall at end-systole. EW
is the area within the P-V loop trajectory (A-B-C-D-A), and PE is the area between
the end-systolic P-V line and the end-diastolic P-V relation curve to the left of
EW (E-C-D-E). (Redrawn from Kameyama T, Asanoi H, Ishizaka S, et al: Energy
conversion efficiency in human left ventricle. Circulation 85:988, 1992.)

