|
|
|
|
|
|
|
|
|
|
|
|
|
|
|
Understanding what OR utilization is plus using it to guide the direction of OR management is a significant part of the OR medical director's job. There are many perceptions of what utilization really is. First, it is important to understand several definitions used in the AACD glossary (see Appendix 2 ).
Case time includes all the time from beginning room setup to room cleanup after the surgical procedure is finished. It accounts for all the time that the OR is dedicated to the performance of a procedure and cannot be used for any other purpose.
Resource hours are the total number of hours that a room is staffed and available for the performance of procedures. Many ORs are staffed for 8 hours of regular resource hours (e.g., 7:00 AM to 3:00 PM). Resource hours do not include time in which overtime or on-call personnel are staffing the OR. Resource hours serve as the denominator in calculating utilization of the available blocked or open scheduled elective OR time.
Raw utilization is equal to the time that patients are in the OR divided by the available resource hours. It does not take into account time spent in getting the OR ready or turnover time; therefore, it will underestimate the actual time that the OR is committed to a case.
Adjusted percent utilization is similar to raw utilization, but it includes case setup time and turnover time. This figure more closely reflects use of the OR in performance of cases in which it is unavailable for any other activity.
Utilization is most commonly determined for a service or group of surgeons who have a set amount of block time.[5] For example, if a group of orthopedic surgeons has block time in two rooms on Monday through Friday, their resource hours per week are 80 (2 rooms × 5 days per week × 8 hours per day). If their total case times (in-room time plus turnover) is 72 hours per week, the adjusted percent utilization is 90% (72 hours per week ÷ 80 hours per week).
For hospitals using utilization to track surgery performance and allocate block time, it is best if the block time is assigned to a group of surgeons or a surgical division. Granting block time to individual surgeons will produce more variability in use and lead to overall lower utilization. Utilization should be tracked regularly and
|
|
Avg hr/wk | Starts/wk | % Utilization Block |
|---|---|---|---|
| Orthopedics | 125 | 17 | 92 |
| General surgery | 128 | 16 | 100 |
| Urology | 71 | 10 | 88 |
| Cardiothoracic surgery | 74 | 15 | 62 |
| Otolaryngology | 72 | 12 | 75 |
| Plastic surgery | 31 | 6 | 64 |
| Neurosurgery | 49 | 9 | 68 |
| Ophthalmology | 9 | 3 | 36 |
| Pediatric surgery | 6 | 2 | 40 |
| Gynecology | 45 | 6 | 93 |
| Other | 11 | — | — |
| Total operating room hours used per week: 621. | |||
The target for optimal utilization is not clearly defined. All the entities involved in the OR have their own view of what represents optimal utilization ( Table 86-12 ). As utilization increases above 80%, surgeons may have difficulty scheduling patients into the time available, and the wait time may create patient dissatisfaction. Studies have shown that for elective procedures in the United States, most patients are willing to wait 1 week.[23] Waiting longer than this because of unavailable block time will lead to patient and surgeon dissatisfaction and possibly loss of the case to another institution. Utilization percentages that are very low represent lost opportunities to generate revenue.
The exact break-even point for utilization is dependent on the
OR's fixed versus variable costs and reimbursement mix. Most ORs seek a utilization
of 70% to 85% to maximize the benefits of the OR and reduce stress on the system.
Often, consultants will quote a figure of 80% to 85% utilization as the target for
all ORs. This figure was actually first used in the 1970s when hospitals were required
to demonstrate a certificate of need before they were allowed to expand their OR
facilities. No standard OR utilization figure exists for what every facility should
achieve. Trends have shown that with increasing surgical volume and reduction in
OR availability, the overall raw
| Utilization | Hospital Administration | Anesthesiology | OR Nursing | Surgeons |
|---|---|---|---|---|
| >100% | ++ | -- | --- | ---- |
| 85%–100% | +++++ | ++ | - | -- |
| 70%–85% | +++ | ++++ | + | +/- |
| 55%–70% | + | +++ | +++ | ++ |
| <55% | -- | - | ++ | ++++ |
| From Mazzei W: AACD Workshop on Operating Room Management, 2003. | ||||
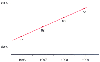 Figure 86-2
Raw utilization for operating rooms.
Figure 86-2
Raw utilization for operating rooms.
It should also be noted that there are costs associated with both underutilization and overutilization. Underutilization incurs fixed costs for the hospital without revenue generation. Overutilization (cases running late) may result in the need for overtime pay for nurses or the need for agency or temporary nurse services, which results in higher costs per minute of OR use. Many recent studies have attempted to define ways to maximize utilization or assist with scheduling to improve percent utilization.[35] [36] [37] [38] [39] [40] Because most ORs have frequent last-minute changes, such as cancellations, add-ons, and emergency cases, the ability to apply these simulations to actual OR practice may be limited.
The use of utilization to assess how well an OR is working is probably incorrect. Utilization is actually just a measure of resource consumption. As an example, a slow surgeon, surgeon A, takes 2.5 hours to perform a laparoscopic cholecystectomy ( Table 86-13 ). He does three procedures in his 8-hour block, which results in a raw utilization of 94% (2.5 hours per case × 3 cases = 7.5 hours; 7.5 hours per 8-hour block = 94%). However, surgeon B, who is faster, completes her laparoscopic cholecystectomies in 1 hour and is able to do six during her 8-hour block. Surgeon B has a raw utilization of 75% (1.0 hour per case × 6 = 6 hours; 6 hours per 8-hour block = 75%). Even though surgeon A has higher utilization than surgeon B does, the financial margin for the hospital will obviously be better with surgeon B.
|
|
Case Time (hr) | No. Cases Performed | Total In-Room Time (hr) |
|---|---|---|---|
| Surgeon A | 2.5 | 3 | 7.5 |
| Surgeon B | 1.0 | 6 | 6.0 |
| Surgeon A |
|
|
|
| Surgeon B |
|
|
Hospitals are becoming more refined at analyzing OR production. By looking at revenue generation and associated costs for each surgeon, they can determine the profit margin for each individual. Although studies have shown that nearly all surgeons contribute a positive profit margin for their OR cases, the range of profit is wide.[41] An example of a report that can be generated with this approach is shown in Table 86-14 . Or managers and hospitals are increasingly using this type of information to make decisions concerning OR resources.
How can OR directors improve utilization or, more specifically, improve throughput and efficiency in the OR? A list of key issues is found in Table 86-15 .
|
|
|
|
|
|
|
|
|
|
|
|
|