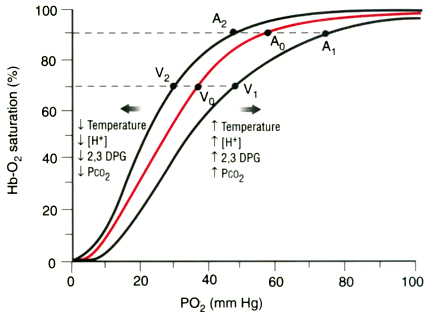
Figure 36-12
Hemoglobin-oxygen (Hb-O2
) saturation curves.
Dotted lines indicate common arterial and venous
values: SaO2
= 90% and Sv̄O2
= 70%. The middle curve (A0
, V0
) represents the relationship
with a pH of 7.40 and body temperature (T) of 37°C. The right-hand curve (A1
,
V1
) would occur if pH = 7.20 or T = 41°C. The left-hand curve (A2
,
V2
) represents the relationship when T = 33°C. Increased levels of
any of the four factors shown (i.e., temperature, pH [H+
], erythrocyte
2,3-diphosphoglycerate [2,3 DPG], and partial pressure of carbon dioxide [PCO2
])
decreases Hb-O2
affinity (i.e., rightward shift); decreased levels raise
Hb-O2
affinity (i.e., leftward shift). The same arterial and venous Hb-O2
saturation under different conditions can therefore result in a wide range of arterial
and venous gas tension values.

